20 results
Common Core HSS-ID.C.9 resources for Microsoft PowerPoint
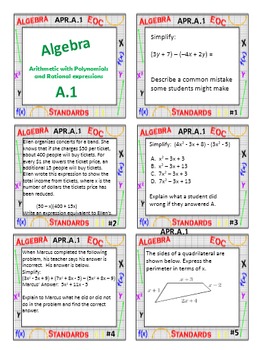
Algebra 1 Review Task Cards
This product covers the domains of Algebra, Functions, Numbers and Quantity, and Probability and Statistics, and includes:
- Task Cards by standard (306 total questions)
- Answer Keys by standard
- Student answer sheets
Each standard adopted by Louisiana for Algebra 1 is covered, however cards can easily be used in other states and by non-CCSS states.
These task cards are a great way to review throughout the year as well as at the end of the year before end of course tests. This allows stu
Subjects:
Grades:
7th - 10th
CCSS:
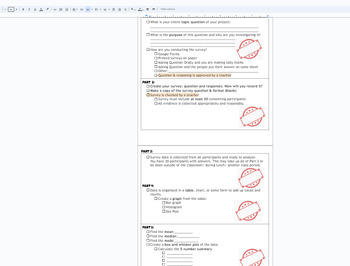
Statistics Survey project Discovery (broken down into sections) with Rubric
This is a broken down (scaffolded) packet of instructions/ guide for a Stats Project for Math 1 HS or 8th grade students. The goal of the project is for students to take a statistical survey on quantitative data (numbers) of their choice. Using this data from the survey, the following will be included in the project:Survey- the question being askedSurvey responses (requirement of 30)Data organization: Bar chart, Histogram, Dot PlotMeanMedianModeBox and Whisket Plot5 number summary (Q1,Q2,Q3, min
Subjects:
Grades:
7th - 12th, Higher Education, Adult Education
CCSS:
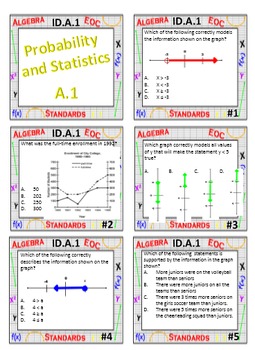
Algebra 1 Review Task Cards - Probability and Statistics
This product covers the domain of Probability and Statistics for Algebra 1 and includes:
- Task Cards by standard (50 total questions)
- Answer Keys by standard
- Student answer sheets
Each standard adopted by Louisiana for Algebra 1 in the Probability and Statistics domain is covered, however cards can easily be used in other states and by non-CCSS states. For a a FREE checklist and description of the standards, please check our store.
These task cards are a great way to review throughout th
Subjects:
Grades:
7th - 10th
Types:
CCSS:
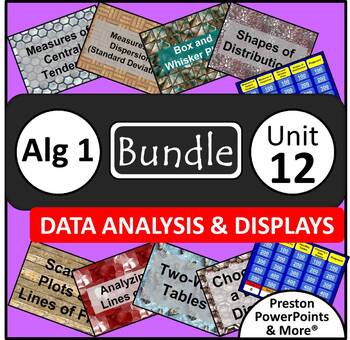
(Alg 1) Data Analysis and Displays {Bundle} in a PowerPoint Presentation
Algebra 1 Data Analysis and Displays {Bundle} in a PowerPoint PresentationThis is a bundle include the eight PowerPoint lessons below and two Quiz Show games, Jeopardy Style, for review.Measures of Central Tendency S.ID.2, S.ID.3Measures of Dispersion (Standard Deviation) S.ID.2, S.ID.3Box-and-Whisker Plots S.ID.1, S.ID.2, S.ID.3Shapes of Distributions S.ID.2, S.ID.3Quiz Show Game Central Tendencies and Dispersion S.ID.1, S.ID.2, S.ID.3Scatter Plots and Lines of Fit 8.SP.1, S.ID.6a, S.ID.6c, S
Grades:
8th - 10th
CCSS:
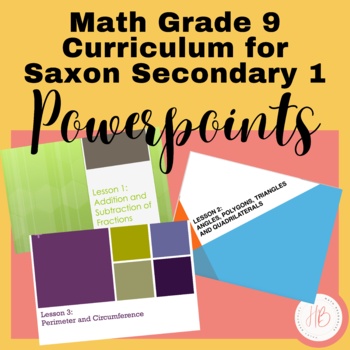
9th Grade Saxon Secondary 1 Math Powerpoints
These 120 Powerpoint lessons work hand in hand with the Saxon Algebra 1 math textbook. If you do not teach the Saxon program then these Powerpoints can be used to help teach the Secondary 1 Common Core. Each Powerpoint consists of a lesson overview which includes formulas and direct instructions. After that there are several practice problems that allows students to put into practice what they just learned. This is a great opportunity for group work as well as for the teacher to walk around the
Grades:
8th - 9th
Types:
CCSS:

Journalism: Market Research Project Slideshow
Prepare your high school journalism students for the exciting world of media with our comprehensive "Market Research Project Slideshow." This 43-slide PowerPoint presentation is thoughtfully designed to guide students through the intricacies of market research, including data analysis, question, and focus generation, all tailored to the context of a high school newspaper.Key Features:Structured Learning: Our slideshow offers a systematic and well-structured approach to teaching market research,
Subjects:
Grades:
7th - 12th
CCSS:
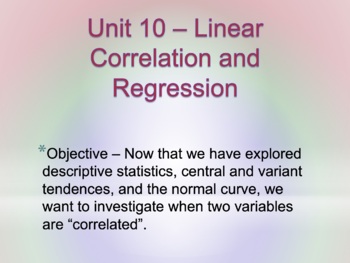
Unit 10 - Correlation & Regression (14 Days)
This is a unit plan bundle for a Statistics class. The plans include common core math standards, time frame, activities, enduring understandings, essential questions, and resources used. It is designed to last 14 days, depending on pacing. The plans include: 29-slide presentation, with annotated guide for reference2 Worksheets1 "Read & Respond" Article Worksheet2 Quizzes"Do Now" Entrance problemsReview slides (for communicator boards)Unit ReviewUnit TestUnit Project - Correlation & Regre
Subjects:
Grades:
10th - 12th, Higher Education
CCSS:
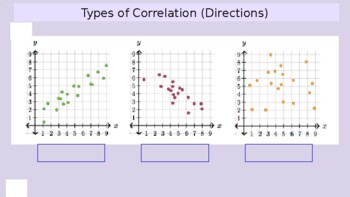
Correlation Coefficient Notes - Scale of r with accompanying scatter plot graphs
Clear notes about the correlation coefficient shown on a scale so students can see both strength, the scatter plot, and the direction all in one.
Subjects:
Grades:
6th - 9th
CCSS:
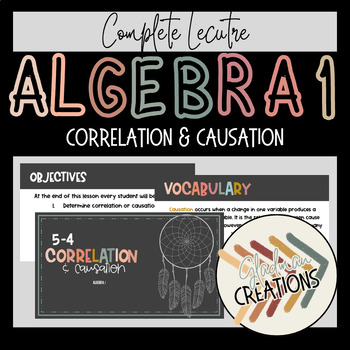
Algebra 1 Lesson - Correlation and Causation
This complete lesson can be used with any curriculum and each student will be able toDetermine correlation or causation.This lesson is done with a bohemian style color pallet; all material is editable, if you need to adjust to your teaching style or your classroom curriculum.
Grades:
9th - 12th
CCSS:
Also included in: Algebra 1 Lesson BUNDLE - Creating Linear Equations
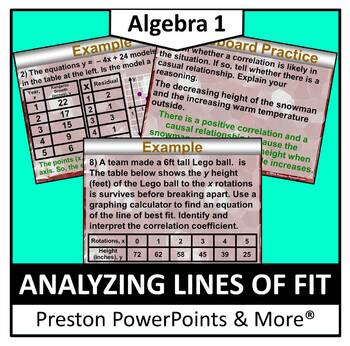
(Alg 1) Analyzing Lines of Fit in a PowerPoint Presentation
Algebra 1 Analyzing Lines of Fit in a PowerPoint PresentationThis slideshow lesson is very animated with a flow-through technique. I developed the lesson for my Algebra 1 class, but it can also be used for upper level class reviews. This lesson teaches how to use residuals to determine whether models are a good fit, find lines of best fit using technology, and identify correlations and causations.This lesson has SKELETON NOTES, notes that have the problem only. I used this with our 1-1 distric
Grades:
8th - 10th
CCSS:
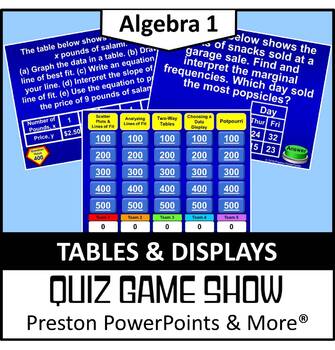
(Alg 1) Quiz Show Game Tables and Displays in a PowerPoint Presentation
Algebra 1 Quiz Show Game Tables and Displays in a PowerPoint PresentationThis Quiz Show game, Jeopardy Style, is a great way to review a chapter. There are 25 questions and a scoreboard so you don’t have to write it on a side board. Each page has the point value!This Quiz Show game covers all of the following:Scatter Plots and Lines of Fit 8.SP.1, S.ID.6a, S.ID.6c, S.ID.7Analyzing Lines of Fit S.ID.6b, S.ID.7, S.ID.8, S.ID.9Two-Way Tables 8.SP.4, S.ID.5Choosing a Data Display S.ID.1NEW: The les
Grades:
8th - 10th
CCSS:
Linear Relationships: Scatter Plots (Linear Regression) - 100+ Slides
These lessons focus on how to read, create and analyze scatter plots. Students use what they already know about linear equations to determine the line of best and use their graphing calculators to determine the correlation coefficient. These lessons includes step-by-step animated lesson notes and practice problems. The slides are fully editable for you and your student's needs. You can pick and choose the slides you need, use other slides for reteaching, duplicate slides and modify them as nee
Grades:
8th - 12th
CCSS:

Scatterplots Statistics Project Group Presentation Experiment
This project requires students to determine a hypothesis, collect data, make a scatterplot, and analyze the scatterplot for an correlations. Then, students will make predictions, determine if their hypothesis was correct, and present their findings to the class. This project can be used as an independent assignment or as a group project. It can be added to Canvas as a Google Assignment. The project comes with an already made rubric.
Subjects:
Grades:
6th - 12th
CCSS:
Math 1 Statistics EOC Review PowerPoint
This is a PowerPoint presentation that accompanies the Statistics EOC Review Packet. This follows a three day review of the Statistics topics in Math 1. You do not need the Statistics EOC Review Packet to use this PowerPoint. The PowerPoint includes slides for warm-ups, lesson reviews on Scatter Plots, Correlation, Line of Best Fit, Residuals, and Univariate Statistics, including Box Plots & Histograms, practice question slides called "White Board Review" and a timer slide for students to wo
Subjects:
Grades:
9th
Types:
CCSS:
Also included in: Math 1 Statistics EOC Review Bundle
LSRL, Regression and Correlation PPT Review Activity (Stat/AP Statistic) No prep
Get ready to supercharge your statistics lesson with this dynamic activity! Your students will have the opportunity to practice finding least square regression lines, correlation, r values, coefficient of determination, and residuals in a fun and engaging way. With 21 questions and answers conveniently displayed on a PowerPoint presentation, you can easily post them on the board for all to see. Perfect for Statistics and AP Statistics classes, this activity will help reinforce key concepts and b
Subjects:
Grades:
9th - 12th
CCSS:
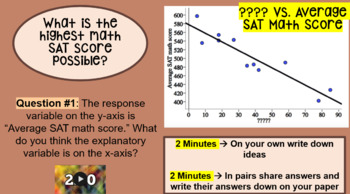
Stats: Inequities in Student Achievement & Poverty (PPT, NOTE SHEET-KEY, CFU)
Empower students to be able to interpret relevant data and make informed decisions based upon that data.Activity Based Learning where students experience first and then formalize their thoughts later.Extremely relevantMath discourse- a lot of room for conversation and critical thinkingProblem solving, reasoning, representation, communication, and connections … Oh my!When and Whereo Pre-Algebra/Algebra 1/Algebra 2: Linear Functions and Equationso Data and Statistics: Analyzing Two-Variable Datao
Subjects:
Grades:
9th - 12th
CCSS:
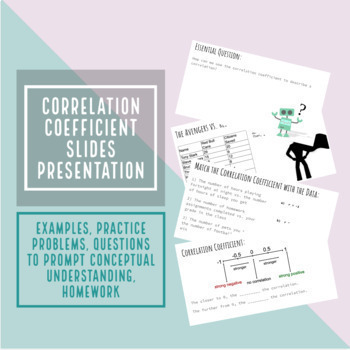
Correlation Coefficient Lesson Slideshow Presentation
Lesson explaining what the correlation coefficient means, how to identify it, and how to use it to describe data. Slideshow includes 15 slides with practice problems, a word problem, and a homework assignment. Answers to practice problems are in the Speaker Notes.
Subjects:
Grades:
8th - 9th
CCSS:
Slope Linear Regression (Test and Confidence Intervals) Marker Board Practice
Get ready to supercharge your statistics lesson with this dynamic activity designed to help your students practice finding slope, linear regression, hypothesis tests, and confidence intervals! With 12 engaging questions and answers conveniently displayed on a PowerPoint presentation, you can easily post them on the board for a visually stimulating classroom experience. Perfect for Statistics and AP Statistics courses, this activity will not only challenge your students but also enhance their und
Subjects:
Grades:
10th - 12th
Types:
CCSS:
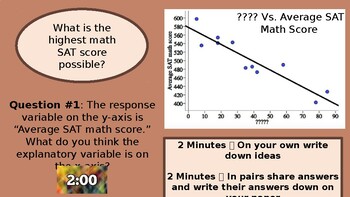
Stats: Inequities Between Student Achievement and Poverty PPT
Empower students to be able to interpret relevant data and make informed decisions based upon that data.Activity Based Learning where students experience first and then formalize their thoughts later.Extremely relevantMath discourse- a lot of room for conversation and critical thinkingProblem solving, reasoning, representation, communication, and connections … Oh my!When and Whereo Pre-Algebra/Algebra 1/Algebra 2: Linear Functions and Equationso Data and Statistics: Analyzing Two-Variable Datao
Subjects:
Grades:
9th - 12th
Types:
CCSS:

Earth's Rotational Axial Tilt at 23.5
This is 4 Virtual labs on the Earth's Rotational Axis at 23.5 degrees during March, June, September and December at Key Latitudes, Polar Circle, Tropics, the Equator, 35N and 41N.
Subjects:
Grades:
9th - 12th
Types:
CCSS:
NGSS:
HS-ESS1-4
, HS-ESS3-1
Showing 1-20 of 20 results

