59 results
Common Core HSS-ID.C.9 microsofts
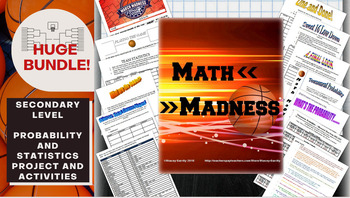
Math March Madness Full Tournament Project {BUNDLE}
Harness the excitement of NCAA March Madness with this huge project for secondary math teachers that follows all stages of the tournament! This Common Core aligned bundle comes with bonus parts not sold individually in my store so you can create a rich immersion in the tournament, practice probability and statistics and learn some interesting new ones along the way! Save $3 plus get bonus content by bundling!You can pick and choose which parts you would like to incorporate, or follow my schedu
Subjects:
Grades:
6th - 12th, Higher Education
Types:
High School Math Common Core Aligned IEP Goal Bank
This IEP goal bank was created to assist special education teachers with the task of writing standards-based IEP goals in math. After spending countless hours developing IEP goals myself and really having to think through how to best individualize goals and objectives for my own students, I wanted to share this resource to help other special education teachers gain back some of their time.This goal bank includes the following:An introduction and guide that explains how to use the document.Each s
Subjects:
Grades:
9th - 12th
CCSS:
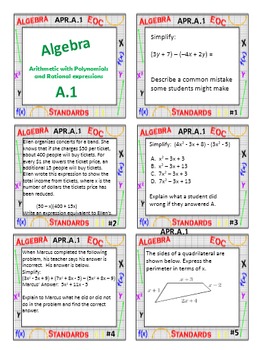
Algebra 1 Review Task Cards
This product covers the domains of Algebra, Functions, Numbers and Quantity, and Probability and Statistics, and includes:
- Task Cards by standard (306 total questions)
- Answer Keys by standard
- Student answer sheets
Each standard adopted by Louisiana for Algebra 1 is covered, however cards can easily be used in other states and by non-CCSS states.
These task cards are a great way to review throughout the year as well as at the end of the year before end of course tests. This allows stu
Subjects:
Grades:
7th - 10th
CCSS:
High School Math IEP Goal Bank - Statistics and Probability
This IEP goal bank was created to assist special education teachers with the task of writing standards-based IEP goals in math. After spending countless hours developing IEP goals myself and really having to think through how to best individualize goals and objectives for my own students, I wanted to share this resource to help other special education teachers gain back some of their time.This goal bank includes the following:An introduction and guide that explains how to use the document.Each s
Subjects:
Grades:
9th - 12th
CCSS:
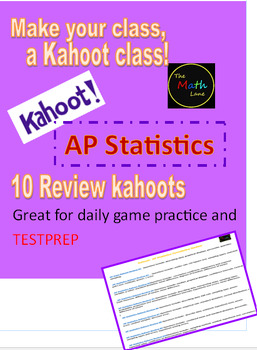
AP Statistics Kahoots (10 total): No Prep game/activity for AP Statistics Exam
Get ready to supercharge your AP Statistics exam prep with these 10 Kahoot links! With 10-15 questions in each Kahoot, your students will have daily practice to help them ace the exam at the end of the year. These Kahoots are specifically designed using AP test material, so you can be sure your students are getting the best preparation possible. Perfect for quick spiral review, warm-ups, or closing out class, these Kahoots are the ultimate tool for helping your students succeed. And with the opt
Subjects:
Grades:
10th - 12th
Types:
CCSS:
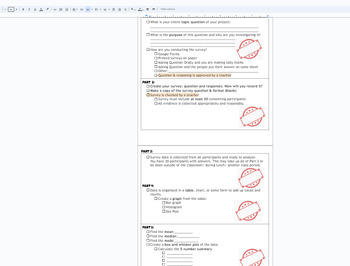
Statistics Survey project Discovery (broken down into sections) with Rubric
This is a broken down (scaffolded) packet of instructions/ guide for a Stats Project for Math 1 HS or 8th grade students. The goal of the project is for students to take a statistical survey on quantitative data (numbers) of their choice. Using this data from the survey, the following will be included in the project:Survey- the question being askedSurvey responses (requirement of 30)Data organization: Bar chart, Histogram, Dot PlotMeanMedianModeBox and Whisket Plot5 number summary (Q1,Q2,Q3, min
Subjects:
Grades:
7th - 12th, Higher Education, Adult Education
CCSS:
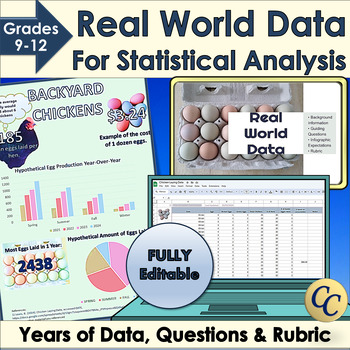
Real World Data for Statistical Analysis and Infographic Project
Give your students access to real world data for your statistical analysis unit or data literacy! Dive into statistics with Microsoft Excel™ or Google Sheets™ and years of data. Learn how to use standard deviation, mean or median to interpret data. Choose the best graphs to display conclusions in an infographic. Works great for science fairs! ✔ Includes an infographic project! (Template, expectations, and rubric). ✔ Everything is fully editable and you and your students can even use the images
Grades:
9th - 12th
Types:
CCSS:
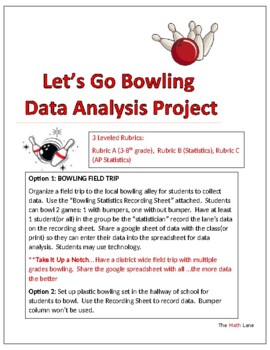
Let's Go Bowling Statistics STEM Project & Field Trip (3-12 and AP Stat)
Great END OF YEAR project. Get ready to strike up some fun with your students on a field trip to the bowling alley or right in your own hallway with a plastic bowling set! This isn't just any ordinary field trip - it's a real-world data collection extravaganza. 3 different leveled rubrics (Grade 4-10, Statistics, AP Statistics) so students can analyze the data based on their math knowledge. Students will be able to practice creating and analyzing graphical displays, scatterplots, construct c
Subjects:
Grades:
Not Grade Specific
Types:
Also included in: High School Statistics Project Bundle
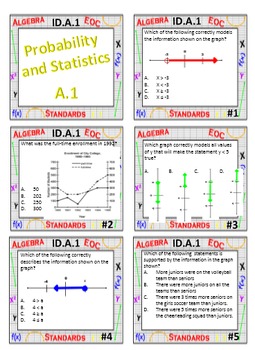
Algebra 1 Review Task Cards - Probability and Statistics
This product covers the domain of Probability and Statistics for Algebra 1 and includes:
- Task Cards by standard (50 total questions)
- Answer Keys by standard
- Student answer sheets
Each standard adopted by Louisiana for Algebra 1 in the Probability and Statistics domain is covered, however cards can easily be used in other states and by non-CCSS states. For a a FREE checklist and description of the standards, please check our store.
These task cards are a great way to review throughout th
Subjects:
Grades:
7th - 10th
Types:
CCSS:
(Alg 1) Data Analysis and Displays {Bundle} in a PowerPoint Presentation
Algebra 1 Data Analysis and Displays {Bundle} in a PowerPoint PresentationThis is a bundle include the eight PowerPoint lessons below and two Quiz Show games, Jeopardy Style, for review.Measures of Central Tendency S.ID.2, S.ID.3Measures of Dispersion (Standard Deviation) S.ID.2, S.ID.3Box-and-Whisker Plots S.ID.1, S.ID.2, S.ID.3Shapes of Distributions S.ID.2, S.ID.3Quiz Show Game Central Tendencies and Dispersion S.ID.1, S.ID.2, S.ID.3Scatter Plots and Lines of Fit 8.SP.1, S.ID.6a, S.ID.6c, S
Grades:
8th - 10th
CCSS:
Math March Madness - A Final Look (Freq Distributions, Stats, Regression Lines)
Fill out a bracket, watch the tournament unfold and then mathematically analyze how you did! This activity is flexible enough to be used for a variety of levels. I have used all 6 pages for an AP Statistics class, and have used pages 1 through 5 for an Algebra or Algebra 2 class. You could even use it in lower levels as long as you are covering percents, and basic stats like mean, median, mode and graphing. The document is editable so you can adjust/delete to tailor to the level of statistic
Subjects:
Grades:
4th - 12th, Higher Education
Types:
9th Grade Saxon Secondary 1 Math Powerpoints
These 120 Powerpoint lessons work hand in hand with the Saxon Algebra 1 math textbook. If you do not teach the Saxon program then these Powerpoints can be used to help teach the Secondary 1 Common Core. Each Powerpoint consists of a lesson overview which includes formulas and direct instructions. After that there are several practice problems that allows students to put into practice what they just learned. This is a great opportunity for group work as well as for the teacher to walk around the
Grades:
8th - 9th
Types:
CCSS:
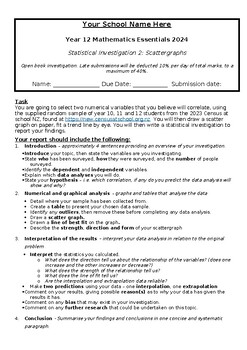
Year 12 Essentials Statistical Investigation - Scattergraphs
Year 12 essentials Statistical Investigation fully aligned to the Western Australian curriculum and SCSA investigation requirements Students to choose 2 numerical variables from the random data sample provided, that they believe will correlate, then analyse the data and complete a statistical report on their findings. Requires students to: create a table of date and scattergraph, fitting a line of best fit, interpolation and extrapolation of data, commenting on causality v correlation. Comes as
Subjects:
Grades:
12th
Types:
CCSS:
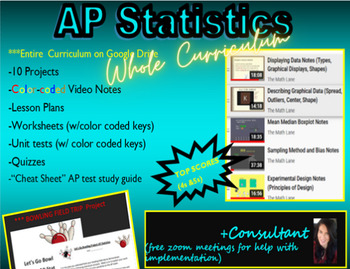
AP Statistics/Stats FULL Curriculum LINK (notes, wksts, PROJECTS) and Consultant
Get ready to supercharge your students' AP Statistics experience with this dynamic curriculum! With over 50% of students earning 4s or 5s on the AP exam, this program is proven to deliver top results. Featuring color-coded video notes, worksheets, activities, and 10 engaging projects, this curriculum is designed to keep students engaged and excited about statistics. Plus, with a Bowling Field Trip Project Opportunity included, students will have the chance to apply their knowledge in a real-worl
Subjects:
Grades:
10th - 12th
CCSS:

Journalism: Market Research Project Slideshow
Prepare your high school journalism students for the exciting world of media with our comprehensive "Market Research Project Slideshow." This 43-slide PowerPoint presentation is thoughtfully designed to guide students through the intricacies of market research, including data analysis, question, and focus generation, all tailored to the context of a high school newspaper.Key Features:Structured Learning: Our slideshow offers a systematic and well-structured approach to teaching market research,
Subjects:
Grades:
7th - 12th
CCSS:
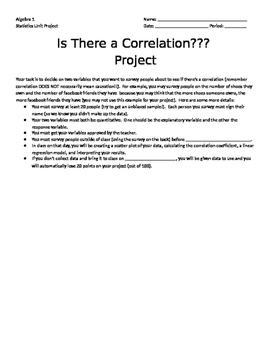
Correlation Project
This is a project I have done at the end of a Statistics unit in Algebra 1. Students survey at least 20 people with two quantitative questions and do a correlation study. The students make a scatter plot and find the line of best fit. Then, they find the linear regression and r value in a calculator and interpret them.
Subjects:
Grades:
9th - 11th
Types:
CCSS:
Unit 10 - Correlation & Regression (14 Days)
This is a unit plan bundle for a Statistics class. The plans include common core math standards, time frame, activities, enduring understandings, essential questions, and resources used. It is designed to last 14 days, depending on pacing. The plans include: 29-slide presentation, with annotated guide for reference2 Worksheets1 "Read & Respond" Article Worksheet2 Quizzes"Do Now" Entrance problemsReview slides (for communicator boards)Unit ReviewUnit TestUnit Project - Correlation & Regre
Subjects:
Grades:
10th - 12th, Higher Education
CCSS:
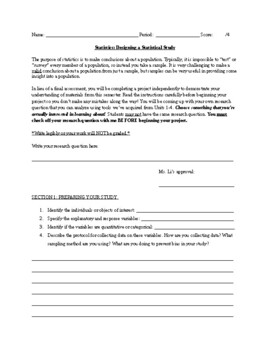
Statistics Project: Regressions + Designing a Statistical Study for High School
Hello!I've designed a statistics project that students in my class loved! This project requires students to go collect data on a topic that interests them. They have to design a sampling method that is as unbiased as possible. Students are then required to analyze their data and summary statistics. They also need to do a regression analysis on their study and make inferences using their results. This is perfect for a replacement of a test or as an end-of-semester project for students. Perfect fo
Subjects:
Grades:
9th - 12th, Higher Education
Types:
CCSS:
Also included in: AP Statistics / High School Statistics Projects
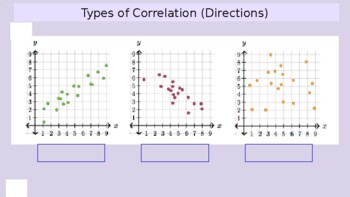
Correlation Coefficient Notes - Scale of r with accompanying scatter plot graphs
Clear notes about the correlation coefficient shown on a scale so students can see both strength, the scatter plot, and the direction all in one.
Subjects:
Grades:
6th - 9th
CCSS:
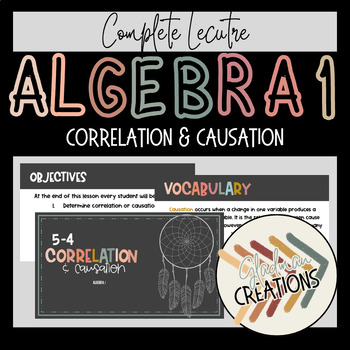
Algebra 1 Lesson - Correlation and Causation
This complete lesson can be used with any curriculum and each student will be able toDetermine correlation or causation.This lesson is done with a bohemian style color pallet; all material is editable, if you need to adjust to your teaching style or your classroom curriculum.
Grades:
9th - 12th
CCSS:
Also included in: Algebra 1 Lesson BUNDLE - Creating Linear Equations
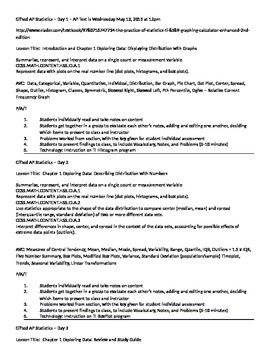
AP Statistics Lesson Plans for 29 Days with CCSS Included
Lesson Plans for High School teachers of AP Statistics. Includes the first half of the course. Common Core State Standards are included for every lesson. Easy to copy and paste into school district lesson plan site. Includes technology, group work, peer evaluation, independent study, and a common sense approach to the day by day student lead teaching of the AP Statistics course. Great template for COMPASS.
Subjects:
Grades:
12th, Higher Education
Types:
CCSS:
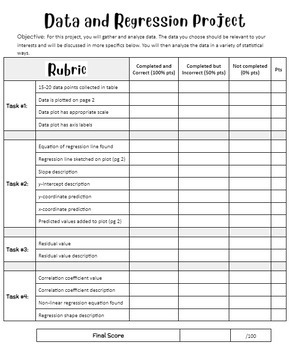
Data and Regression Project
Sample includes directions. Actual product includes directions, rubric, and student worksheet. In this project students will generate a data set of two potentially correlated variables. They will then analyze this data with regression equations, residuals, and correlation coefficients. This is a great project to get to know what interests your students and a good chance for student collaboration. A great chance for PBL in the math classroom as well.
Subjects:
Grades:
9th - 12th
Types:
CCSS:
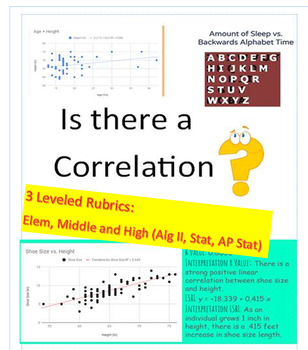
Correlation? Data Project (3 Rubrics_Elem/Middle School/ AP Stats) EOY
Get ready to supercharge your students' data analysis skills with this dynamic project! Perfect for end of year or semester project. In this engaging activity, students will have the exciting opportunity to collect their own data through surveys, online research, or real world data sets. They will then dive deep into the world of statistics as they determine if there is a correlation between two variables. With three different leveled rubrics, this project is perfect for students of all ages an
Subjects:
Grades:
Not Grade Specific
Types:
CCSS:
Also included in: High School Math Projects (Algebra II and Statistics) STEM No prep
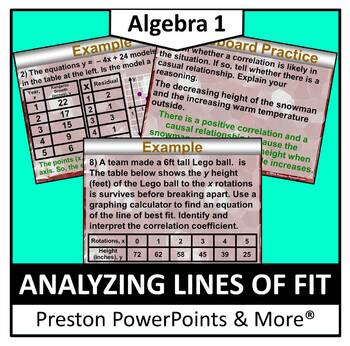
(Alg 1) Analyzing Lines of Fit in a PowerPoint Presentation
Algebra 1 Analyzing Lines of Fit in a PowerPoint PresentationThis slideshow lesson is very animated with a flow-through technique. I developed the lesson for my Algebra 1 class, but it can also be used for upper level class reviews. This lesson teaches how to use residuals to determine whether models are a good fit, find lines of best fit using technology, and identify correlations and causations.This lesson has SKELETON NOTES, notes that have the problem only. I used this with our 1-1 distric
Grades:
8th - 10th
CCSS:
Showing 1-24 of 59 results

