55 results
Common Core HSS-ID.C.9 resources for Google Apps
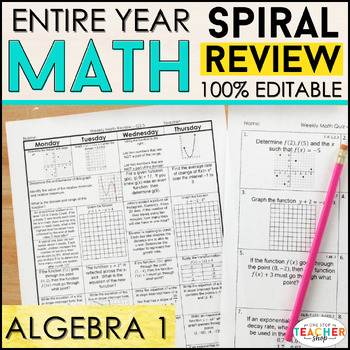
Algebra 1 Spiral Review | Homework, Algebra 1 Warm Ups, Progress Monitoring
This Algebra 1 spiral review & quiz resource can easily be used as HOMEWORK, WARM-UPS, or a DAILY MATH REVIEW! This resource was designed to keep math concepts fresh all year and to help you easily track student progress. All pages are 100% EDITABLE and easy to differentiate to fit your students' needs.⭐⭐UPGRADE for just $10 and get both PRINT & DIGITAL versions } CLICK HERE✪ CLICK HERE to see more SUBJECTS & GRADE LEVELS!★★SAVE $$ with these BUNDLES★★Algebra 1 Bundle: Spiral Review,
Subjects:
Grades:
8th - 10th
Types:
CCSS:
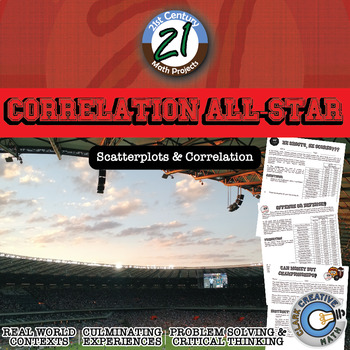
Correlation All-Star -- Sports Data Analysis - 21st Century Math Project
Bring an authentic sports-based math project to your Algebra, Algebra 2 or PreCalculus classroom with Lines of Best Fit and Correlations! All in this 21st Century Math Project! Using data from the MLB, NBA, NFL and NHL students investigate correlations to some of sports most common questions like: "Do more shots result in more goals?" "Do hitters or pitchers have more impact on a team's wins?""What NFL stat is most strongly correlated with wins?" and the grand-daddy..."Can money buy championship
Subjects:
Grades:
7th - 12th
Types:
CCSS:
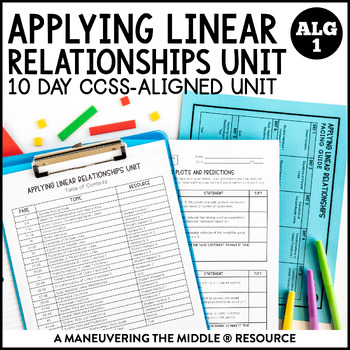
Applying Linear Relationships Unit | Parallel & Perpendicular Lines | Algebra 1
A 10-day Applying Linear Relationships CCSS-Aligned complete unit including concepts of applying linear relationships. Students will solve problems involving direct variation, write equations of parallel and perpendicular lines, describe transformations of linear functions, calculate the correlation coefficient of linear scatter plots and write equations for lines of best fit on a scatter plot.Students will practice with both skill-based problems, real-world application questions, and error anal
Subjects:
Grades:
8th - 9th
Types:
CCSS:
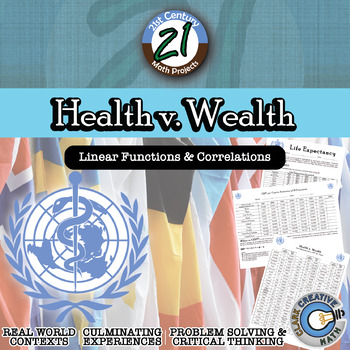
Health v. Wealth -- International Data & Correlation - 21st Century Math Project
Correlations and causation should be abundantly clear when students examine data of the Health and Wealth of over 80 nations around the world. The world is ever-changing and it is important for students to have a basic level of global awareness. In this 21st Century Math Project, students will use real world data to model regression functions, examine correlations and predict the future. In this project students will investigate global data sets to examine potential correlations related with the
Subjects:
Grades:
7th - 12th
Types:
CCSS:

Algebra 1 - ENTIRE YEAR - Exit Tickets for Google Forms™
About This Resource:This is a bundle of all 88 of my Google Forms Exit Tickets that relate to Algebra 1 content and their standards. The instructions for each exit ticket are easy to follow for you to make a copy of the Google Form into your Google Drive. Then you can assign to your students using Google Classroom or some other method.What's Included:Above you can preview each of the exit tickets to see what you will receive. I am continually adding more exit tickets to the collection. You will
Subjects:
Grades:
9th - 11th
Types:
CCSS:
Measures of Center & Variance Unit Bundle - Distance Learning Compatible
This is a selection of my Measures of Center & Variance resources all in a money saving Essential Bundle! You save significant money and time versus purchasing these separately!Essential Bundles are designed to give you everything you need to rock your unit. Warmups, Notes, Activities, Games, Exit Tickets, and Tests. You will find a selection of my Drive Instruction, Escapes, Boot Camp, Adventures, Whodunnits, CSI, Person Puzzles, STEM-ersions, Herowork, TableTop and my 21st Century Math Pro
Subjects:
Grades:
6th - 12th
Types:
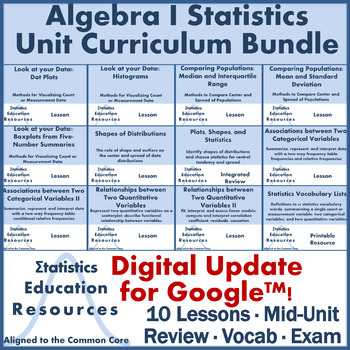
Bundle: Algebra 1 Statistics Unit Curriculum (Common Core)
UPDATE: Now includes lesson slides and editable worksheets for Google™ Slides and unit exam in Google™ Forms!Algebra I Statistics Unit BundleThis product is a bundle that includes 10 Common Core Aligned lessons, 4 statistics vocabulary lists (1 master list for the whole unit, and 3 smaller unit “sub lists”), 1 mid-unit integrated mini-review and worksheet (as homework or a quiz!), and 1 exam with answer key. Each lesson includes lecture slides with speaker notes, a handout, worksheet with answer
Subjects:
Grades:
8th - 11th
Types:
CCSS:
High School SBAC Assessment Practice Test - (Google Forms™ and Paper Included)
About This Resource:We all have the pressure of our students performing well on the SBAC. It can be a very intimidating test! I have spent countless hours researching the SBAC summative assessment blueprint and creating items that meet the rigor of the item specifications. Your students will be fully prepared for the test with this resource!What's Included:Claim 1 Practice Test already set up in Google Forms with auto gradingClaim 1 Practice Test in Paper formatClaim 1 Answer Key in PDF formatCl
Subjects:
Grades:
9th - 12th
Types:
CCSS:
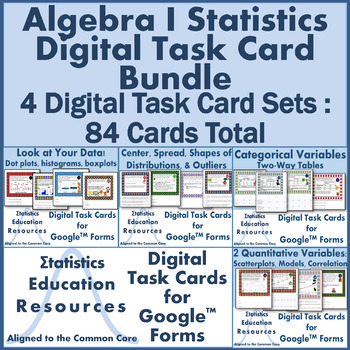
Bundle: Algebra I Statistics Digital Task Cards (84 Cards)
Distance Learning: Algebra I Statistics Digital Task Card Bundle These digital task cards are adapted from the printable version of Algebra I Statistics Task Card Bundle available here. This product is a bundle that includes 4 sets of Common Core-Aligned digital task cards (84 cards total) each created in Google™ Forms. These digital task cards are perfect for distance learning, independent work, graded assessments, or practice. This resource includes answer key with feedback, multiple editable
Subjects:
Grades:
8th - 12th
Types:
CCSS:
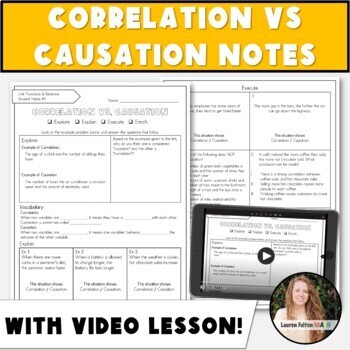
Correlation vs Causation Notes | Association
Looking for Correlation vs Causation Guided Notes & Practice? This set comes complete with a VIDEO LESSON + Digital and Printable version, so you have everything you need to teach association vs causation!Problem Types Include: Differentiating between correlation and causation given real-world scenarios. My Algebra Guided Notes Contain 4 Sections:✨Explore section for students to explore the topic before direct instruction✨Explain section for direct instruction✨Execute section with ind
Grades:
9th
Types:
CCSS:
Correlations & Adv Stats Unit Bundle - Pre-Calc - Distance Learning Compatible
This is a selection of my Correlations & Advanced Stats resources all in a money saving Essential Bundle! You save significant money and time versus purchasing these separately!Essential Bundles are designed to give you everything you need to rock your unit. Warmups, Notes, Activities, Games, Exit Tickets, and Tests. You will find a selection of my Drive Instruction, Escapes, Boot Camp, Adventures, Whodunnits, CSI, Person Puzzles, STEM-ersions, Herowork, TableTop and my 21st Century Math Pro
Subjects:
Grades:
9th - 12th
Types:
CCSS:
Bundle: Probability and Statistics COVID-19 Digital Activities (Common Core)
Bundle: Probability and Statistics COVID-19 Digital Activities (Common Core) This product is a bundle that includes 6 digital activities that were created in Google™ Slides. Each activity includes a background context relevant to COVID-19, summaries of real-world COVID-19 data derived from international or national health organizations or published research reports, detailed answer key, and instructions for accessing the activities. These activities are very challenging, focused on statistical
Subjects:
Grades:
9th - 12th
Types:
CCSS:
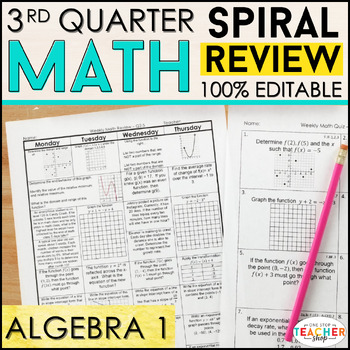
Algebra 1 Review & Quizzes | Homework or Warm Ups | 3rd QUARTER
This Algebra 1 spiral review & quiz resource can easily be used as HOMEWORK, WARM-UPS, or a DAILY MATH REVIEW! This resource was designed to keep math concepts fresh all year and to help you easily track student progress. All pages are 100% EDITABLE and easy to differentiate to fit your students' needs.☝☝ Check out the Preview for more details and 3 FREE Weeks! ☝☝Get the ENTIRE YEAR BUNDLE! {CLICK HERE}★★★★★★★★★★★★★★★★★★★★★★★★★★★★★★★★★★★★★★★★★★★★★★★★★★★★★★★★★★★★★Go 100% Paperless with my GOO
Subjects:
Grades:
8th - 9th
Types:
CCSS:
Lesson: Linear Regression, Residuals, Correlation vs. Causation (Common Core)
UPDATE: Now includes lecture and worksheet with editable features for Google Slides™ !Relationships between Two Quantitative Variables: Linear Regression Models, and Correlation vs. Causation (Common Core Aligned Lesson) This product includes a lesson plan with worksheet and answer key aligned with the common core. Students review how represent the relationship between two quantitative variables on a scatterplot. Students learn how to fit and interpret linear regression models; how to compute a
Subjects:
Grades:
8th - 12th
Types:
CCSS:
Also included in: Bundle: Algebra 1 Statistics Unit Curriculum (Common Core)
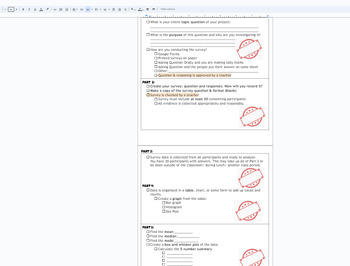
Statistics Survey project Discovery (broken down into sections) with Rubric
This is a broken down (scaffolded) packet of instructions/ guide for a Stats Project for Math 1 HS or 8th grade students. The goal of the project is for students to take a statistical survey on quantitative data (numbers) of their choice. Using this data from the survey, the following will be included in the project:Survey- the question being askedSurvey responses (requirement of 30)Data organization: Bar chart, Histogram, Dot PlotMeanMedianModeBox and Whisket Plot5 number summary (Q1,Q2,Q3, min
Subjects:
Grades:
7th - 12th, Higher Education, Adult Education
CCSS:
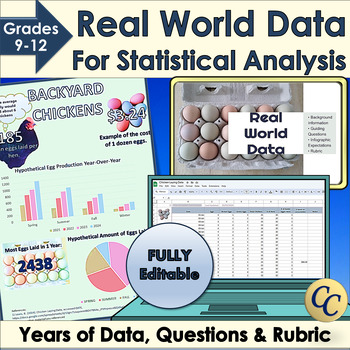
Real World Data for Statistical Analysis and Infographic Project
Give your students access to real world data for your statistical analysis unit or data literacy! Dive into statistics with Microsoft Excel™ or Google Sheets™ and years of data. Learn how to use standard deviation, mean or median to interpret data. Choose the best graphs to display conclusions in an infographic. Works great for science fairs! ✔ Includes an infographic project! (Template, expectations, and rubric). ✔ Everything is fully editable and you and your students can even use the images
Grades:
9th - 12th
Types:
CCSS:
FBI Most Wanted AP Statistics Linear Regression
I created a series of activities for several units in the AP Statistics curriculum. The students love using data from fbi.gov to review concepts. This activity involves analyzing data related to the top 10 most wanted fugitives. I created this activity in May of 2020 and used the top 10 at that time. In the folder, you will find an editable slide of the top 10 if you want to change it.The answer key for the unit is based on the original top 10 that I used. Teachers have the option of having stud
Subjects:
Grades:
9th - 12th
Types:
CCSS:
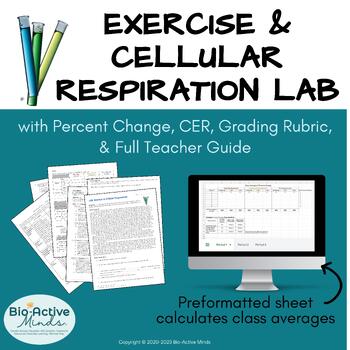
Exercise & Cellular Respiration LAB for Biology with CER, Rubric & Teacher Guide
In this interactive lab, students investigate the effect of exercise on the rate of cellular respiration by measuring heart rate, breathing rate, and carbon dioxide production (by exhaling into a BTB solution) at rest and after two exercise intervals.Students assign pre-defined lab roles and work collaboratively in groups of 3 (or 4) to carry out the procedure and collect data. Lab groups report data to the teacher for class averages (which can be displayed to guide the post lab discussion). Gro
Subjects:
Grades:
8th - 12th, Higher Education
Types:
CCSS:
NGSS:
HS-LS2-3
, HS-LS1-2
, HS-LS1-3
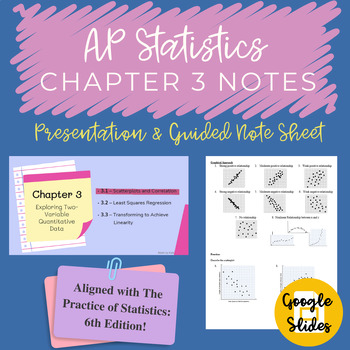
AP Statistics Chapter 3 Notes Google Slides and Guided Notes
Aligned with The Practice of Statistics (Sixth Edition); a presentation for the second full chapter of AP Statistics (3.1, 3.2 and 2.3), Exploring Two-Variable Quantitative Data. Includes: Scatterplots and Correlation, Least Squares Regression, and Transforming to Achieve Linearity . This file includes PowerPoint presentations for 3.1, 3.2 and 3.3, along with their associated guided notes.This file is in Google Slides format for the presentation and a PDF of the notes (Found as a link on the fir
Subjects:
Grades:
10th - 12th
Types:
CCSS:
Bundle: Algebra 1 Statistics Unit Lessons & Activities (Common Core)
This MEGA bundle includes 10 Common Core Aligned lessons, 4 statistics vocabulary lists (1 master list for the whole unit, and 3 smaller unit “sub lists”), 1 mid-unit integrated mini-review and worksheet (as homework or a quiz!), and 1 exam with answer key, and over 20 printable and digital statistics activities aligned with Common Core standards typically covered in Algebra 1. Each lesson includes lecture slides with speaker notes, a handout, and worksheet with answer key and rubric. A suggeste
Subjects:
Grades:
8th - 11th
Types:
CCSS:
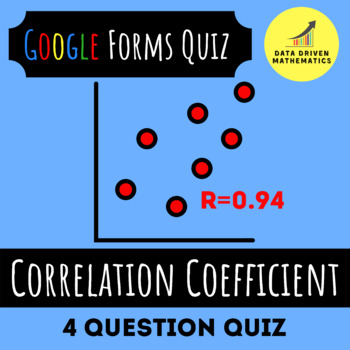
Google Forms™ Quiz - Correlation Coefficients
About This Resource:This is a Google Forms Quiz on linear regressions. The instructions are easy to follow for you to make a copy of the quiz to your Google Drive. Then you can assign to your students using Google Classroom or some other method.Questions on this assessment were carefully created to give our students the best practice on the following standard.S.ID.6c - Fit a linear function for a scatter plot that suggests a linear association.S.ID.8 - Compute (using technology) and interpret th
Subjects:
Grades:
9th - 12th
Types:
CCSS:
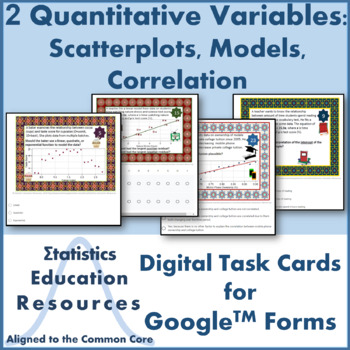
Digital Task Cards for Scatterplots, Models, Correlation
Distance Learning: 2 Quantitative Variables Digital Task Cards: Scatter plots, Models, Functions, Correlation (Common Core Aligned) These digital task cards are adapted from the printable version of the 2 Quantitative Variables Digital Task Cards: Scatter plots, Models, Functions, Correlation available here. This product includes 24 task cards created with Google™ Forms: 8 task cards on scatter plots to describe relationships (linear, quadratic, exponential)4 task cards on interpreting slope and
Subjects:
Grades:
8th - 12th
Types:
CCSS:
Also included in: Bundle: Algebra I Statistics Digital Task Cards (84 Cards)
Investigate a COVID-19 Correlate using Linear Models of Real Data
Distance Learning: Investigate a COVID-19 Correlate using Linear Models with Real-World Data (Common Core) This Google™ Slides digital activity involves interpreting real US state health department surveillance data on COVID-19 as a member of a team of statisticians. Students will estimate a line of best fit using a scatterplot with county-level COVID-19 case rates and county-level age distributions. Next, students will interpret the model, evaluate the model fit using residuals, and identify re
Subjects:
Grades:
8th - 12th
Types:
CCSS:
Correlation Coefficient - Printable & Digital Activity - Chico Mendes Puzzle
Bring to life the traditional practice class or homework assignment with some global competency and diversity! While your students practice with correlation coefficients, they can learn about the courageous worker right's advocate, Chico Mendes!Person Puzzles are designed to highlight individuals with diverse backgrounds who have made significant contributions to our world. I typically use Person Puzzles as timed warm-ups which allows me to share a little about the person's background before my
Subjects:
Grades:
8th - 12th
Types:
CCSS:
Showing 1-24 of 55 results

