226 results
End of Year statistics resources for Microsoft Excel
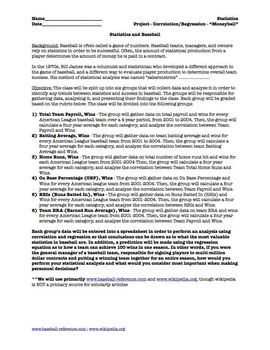
Statistics Correlation and Regression Project for Movie "Moneyball" (5 day)
Prerequisite: Correlation and Regression (Linear). This is a project that divides a statistics class into 6 groups and students do ACTUAL data collection from given websites and they perform their OWN ANALYSIS. They will use computers/internet/excel/spreadsheets/graphing calculators to evaluate correlation. If you have interest in baseball and statistics, this is a great project to get the class interested, and covers about 5 days, plus you can watch the movie "Moneyball" afterwards as a reward.
Subjects:
Grades:
10th - 12th, Higher Education, Adult Education
Types:

DISNEYWORLD: A Microsoft Excel Project and PowerPoint Project
Disneyworld: A Microsoft Excel Project and PowerPoint Project is designed to be a high interest, engaging, end-of-year project or end-of-the-semester project, taking approximately two – three-weeks for students to complete and another week for class presentations. Students will be asked to do the following: Internet Research: Students will be researching airline costs, Disneyworld admission costs, lodging and lodging costs, Special Disneyworld tours and entertainment, and rules of when they wil
Grades:
6th - 12th
Also included in: Microsoft EXCEL Activities - 6 PROJECTS!
12 Days of Christmas: A Computer Spreadsheet Activity
This great holiday activity shows students how to use a computer spreadsheet to calculate the cost of their true love's gifts in today's dollars.The simple step-by-step procedure will allow both beginning and computer-savvy students to experience success as they learn how to use spreadsheet software. Students will enjoy the engaging and entertaining activity. No computer? No problem! Use the activity master so students can calculate the costs themselves.
Grades:
5th - 9th
Types:

Kindergarten Graduation/Promotion + Student Awards
Celebrate your Kindergartener's graduation/promotion by having a ceremony virtually or in person! All resources are customizable to fit the needs of your classroom and school; however, the clipart, banner, and titles on the invitations and programs are not editable and are specific to this resource.Included in the virtual ceremony product are the following in both PowerPoint and Google Slides formats:Invitation templates in red, blue, and black/whiteTwo program templates (one-page and two-page o
Subjects:
Grades:
K
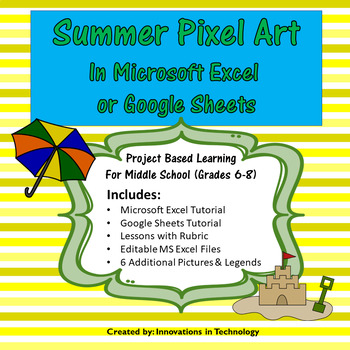
Summer Pixel Art in Microsoft Excel or Google Sheets | Distance Learning
Need a fun way to introduce Microsoft Excel or Google Sheets to upper elementary or middle school students? This great lesson incorporates Summer themed art as students learn the basics of Microsoft Excel or Google Sheets. First, they'll create a quick pixel art from a given example and then they'll create their own! These are also fun lessons to use if you just need something for a one day lesson.This lesson is great for distance learning/remote learning. You can upload it to your school's
Grades:
6th - 8th
Types:
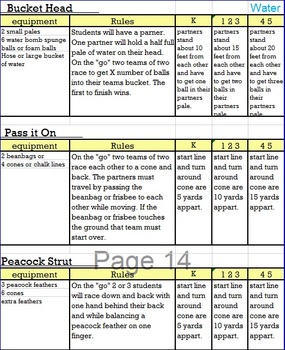
Field Day the Easy Way
No waiting for groups to finish and rotate.No waiting for groups to listen to directions.Students work at their own pace. I have tried several different ways to run a field day, and I have found this to be the easiest way to do it. I have also found that the classroom teachers perfer this design as well. The intention of this design is to keep things simple for everyone involved. Volunteers will have instruction cards for simple games that require students to either “beat the clock” by finishin
Subjects:
Grades:
K - 5th
Types:
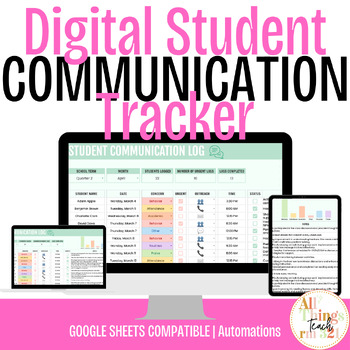
*NEW - Student Communication Tracker | Volume 2
Welcome to the Student Communication Log | Volume 2, Check out the VIDEO CLIPS to this resource! VIDEO 1 (this resource went VIRAL) VIDEO 2 I shared a limited time free modified version of this tracker during my Drop 004 in my Facebook Group, Paper to Pixels. I am finally sharing it here in my shop with UPGRADES! If you looking for a simple yet powerful tool to track and manage student communication effectively, then this is the ultimate tracker that will help you to track student interaction
Grades:
Not Grade Specific
Types:
Also included in: *NEW Collection - Classroom Bundle of 11 Digital Trackers
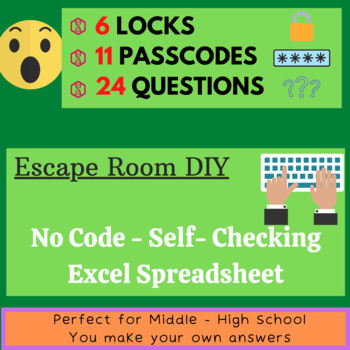
Escape Room - No Code DIY - Excel
So ever searched TpT and haven't quite found the Activity you were looking for? Especially an Escape Room? Well look no further, this Zip file includes an Excel file and a pdf with instructions on how to create your very own Escape Room. There are 6 levels, each with 4 multiple choice questions and each has a lock to open and they are all colour coded. Not only do you input the questions/answers but you also can create the passcodes for the locks and the levels. The Excel file is already set up
Subjects:
Grades:
Not Grade Specific
Types:
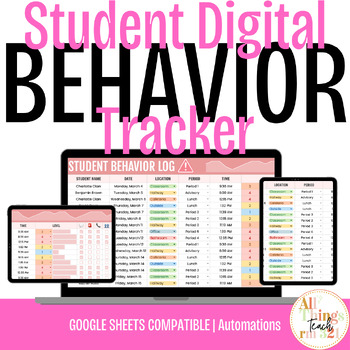
*NEW - Student Behavior Log Tracker
Welcome to the Student Behavior Log Tracker, Check out the VIDEO CLIPS to this resource! VIDEO 1 VIDEO 2 I shared a limited time free modified version of this tracker during my Drop 004 in my Facebook Group, Paper to Pixels. I am finally sharing it here in my shop with UPGRADES! Are you looking for a reliable tool to track and manage student behavior effectively? Say hello to this Student Behavior Log! This spreadsheet will help you to monitor, analyze, and address student behavior. Whether yo
Grades:
Not Grade Specific
Types:
Also included in: *NEW Collection - Classroom Bundle of 11 Digital Trackers
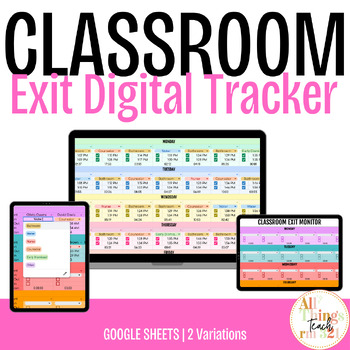
*NEW - Digital Classroom Exit Monitor
Welcome to the Digital Classroom Exit Monitor, Check out the VIDEO CLIPS to this resource! VIDEO 1 VIDEO 2 Are you tired of the challenges associated with monitoring student exiting from the classroom? This Digital Classroom Exit Monitor is designed to streamline the tracking process for students leaving the classroom for various reasons, including bathroom breaks, water refills, counseling sessions, nurse visits, and more. This tracker will help you to document student departures, track the r
Grades:
Not Grade Specific
Types:
Also included in: *NEW Collection - Classroom Bundle of 11 Digital Trackers
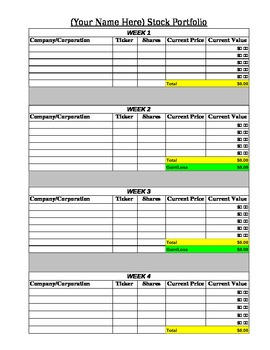
Stock Market Portfolio Tracking Spreadsheet
This document is an Excel spreadsheet which has already been formulated for students to use as part of a Stock Market unit. As students research and track their stocks, they will enter their data into the spreadsheet and their profit/loss will be automatically calculated along with a graph for students to analyze their results.
Subjects:
Grades:
4th - 8th
Types:
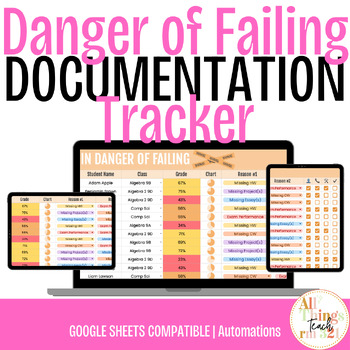
*NEW - Students In Danger of Failing Documentation Log
Welcome to the Students in Danger Documentation Log, Check out the VIDEO CLIPS to this resource! VIDEO 1 VIDEO 2 I shared a limited time free modified version of this tracker during my Drop 004 in my Facebook Group, Paper to Pixels. I am finally sharing it here in my shop with UPGRADES! If you have students who are at risk of failing and falling through the cracks, this digital tracker will help you to identify, monitor, and support students in danger of failing. Packed with powerful analytics
Grades:
Not Grade Specific
Types:
Also included in: *NEW Collection - Classroom Bundle of 11 Digital Trackers
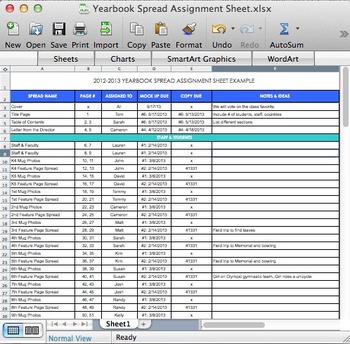
Yearbook Spread Assignment Sheet
I am the yearbook teacher for a Preschool-12th grade international school overseas. My first year, I had 14 secondary students and less than a semester to create the yearbook.
The first week, I had all of the students sign up for a Gmail account if they didn't have one already. For almost every step of the process, I had students refer to documents on Google Drive, especially for their spread assignments. If they forget which one they had next or when it was due, I told them to look it up onli
Grades:
9th - 12th
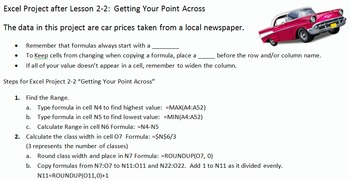
Excel Projects for Statistics Frequency Distributions and Charts
This file contains three different projects with solutions and a quick reference card for students. It correlates to Bluman's Elementary Statistics textbook.
First is an Introduction to Excel. There is an example, guided practice and then 4 Projects. The instructions are on each sheet. The topics covered are: basic editing and formatting, beginning charts, beginning formulas, such as SUM and AVERAGE, and calculations. There is an editable grading rubric for this project. The Preview file
Subjects:
Grades:
8th - 11th, Higher Education, Adult Education
Types:
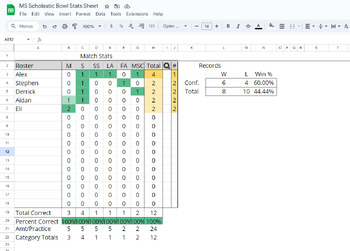
MS Scholastic Bowl / Quiz Bowl Stat Sheet
DISCLAIMER: Made for IESA-Compliant Scholastic Bowl. 24 questions per round, 10 point toss-ups, 4 part bonus (each bonus worth 5 points).This is a stat sheet for MIDDLE SCHOOL Scholastic Bowl/ Quiz Bowl practices and games. It adapts in real-time to update the scoreboard and team totals when a name and category abbreviation is applied (see thumbnails for example) The sheet tracks math, science, social studies/history, language arts, fine arts, and miscellaneous questions. It is incredibly useful
Subjects:
Grades:
6th - 8th
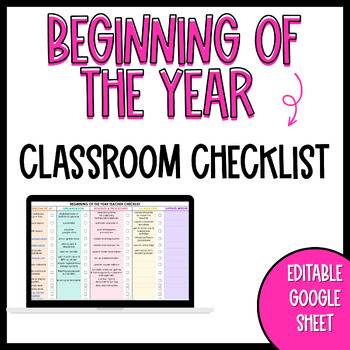
BEGINNING OF THE YEAR TEACHER CHECKLIST
Even as a veteran teacher, it is HARD to keep up with the long list of TO DO's at the start of each school year. That's why I've created this beginning of the year teacher checklist. If you are feeling overwhelmed with the amount of tasks you need to accomplish before the start of the year & fear you will FORGET SOMETHING.. then this checklist is for YOU! This editable google sheet checklist includes beginning of the year tasks divided into 4 categories; classroom set uporganizationroutines
Grades:
Not Grade Specific
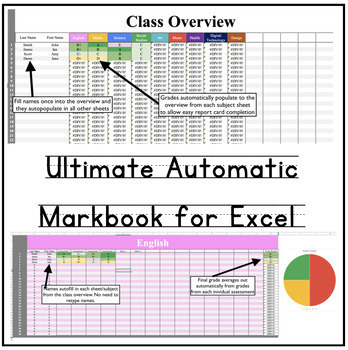
Ultimate Automatic Markbook for Excel - Customisable (Primary and Highschool)
Introducing the ultimate solution for simplifying your grading process: the Automatic Excel Grade Book. This comprehensive tool is designed to make managing student performance effortless, perfect for educators, tutors, and instructors.Seamless Automation: Our Excel Grade Book automates the entire grading process, from data entry to computation. Generate comprehensive reports and track student progress effortlessly.Customizable Templates: Tailor the grade book to your specific needs with customi
Subjects:
Grades:
Not Grade Specific
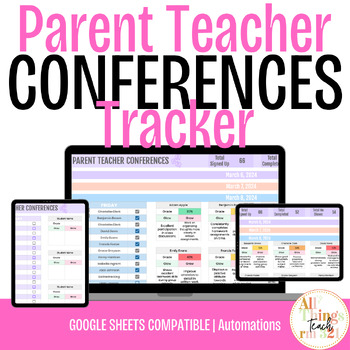
*NEW - Parent Teacher Conferences Tracker
Welcome to the Parent Teacher Conferences Tracker, Check out the VIDEO CLIPS to this resource! VIDEO 1 I shared a limited time free modified version of this tracker during my Drop 004 in my Facebook Group, Paper to Pixels. I am finally sharing it here in my shop with UPGRADES! Are you ready to take the chaos out of parent-teacher conferences and streamline your tracking process? This digital tracker will allow you to efficiently track student appointments, monitor attendance, and manage confer
Grades:
Not Grade Specific
Types:
Also included in: *NEW Collection - Classroom Bundle of 11 Digital Trackers
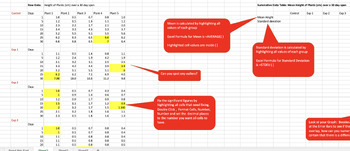
Bundle - Help with Science Fair Table, Graphs, Statistics using Excel.
This comprehensive 3-part bundle comprises a video tutorial, an informative handout, and an Excel file meticulously guiding students through a step-by-step process. The aim is to empower students with the skills to transform raw data into concise summative data tables and graphs, complete with standard deviation error bars. The tutorial covers the entire spectrum – from utilizing Excel for table and graph preparation to conducting statistical analyses using Anova tests, t-tests, or correlation m
Subjects:
Grades:
9th - 12th
Types:

Statistics Unit 9 Bundle - Hypothesis Testing (one sample) (18 days)
This is a unit plan bundle for a Statistics class. The plans include common core math standards, time frame, activities, enduring understandings, essential questions, and resources used. It is designed to last 18 days, depending on pacing. The plans include: 56-slide presentation, with annotated guide for reference5 Worksheets1 "Read & Respond" Article Worksheet2 Quizzes"Do Now" Entrance problemsSpreadsheet Activity - Hypothesis TestingReview slides (for peer presentations)Unit ReviewUnit Te
Subjects:
Grades:
10th - 12th, Higher Education
Types:
CCSS:
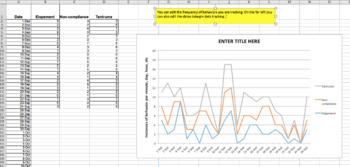
More Graphs Added! Graphing Basic Data For Students: An Excel Workbook
This is a great resource to use for data tracking for all of your students or clients. I have expanded the other Graphic Workbook on my TPT store. This resource is made to easily create graphs for a variety of skills or behaviors. As a result, this excel workbook can be used by teachers, behavior analysts, speech therapists, behavior intervention specialists, really anyone who needs data collection. The graphs can be shared during parent-teacher conferences, IEP meetings, included in student pro
Subjects:
Grades:
Not Grade Specific
Types:
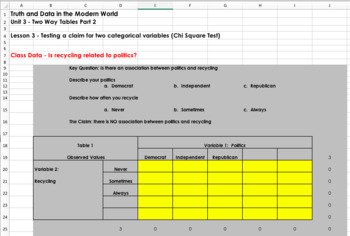
Teaching Statistics with Spreadsheets (Self Grading)
You can see a video that describes the basics of this course at the following link: https://www.youtube.com/watch?v=uZFpltXWyw8This package is an entire statistics course designed for content to be delivered, taught, practiced, and assessed through spreadsheets. Students learn basic statistics and spreadsheet skills. This course is intended to allow for student collaboration and group work throughout the learning process. Each spreadsheet is automatically graded so students can see their progres
Grades:
9th - 12th
Types:

VM Numeracy Unit 2 - Civics - Data and Uncertainty
VCE VM Unit 2 Numeracy book, Civic - Data and Uncertainty. This unit looks at odds, reading and interpreting data, probability and statistics. Includes many hands-on activities.
Subjects:
Grades:
10th - 12th
Types:
Also included in: Bundle 1
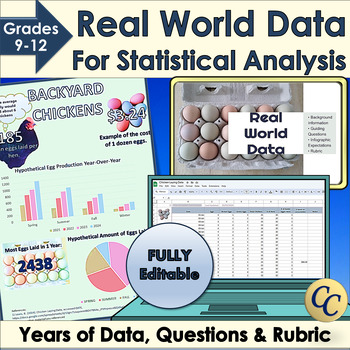
Real World Data for Statistical Analysis and Infographic Project
Give your students access to real world data for your statistical analysis unit or data literacy! Dive into statistics with Microsoft Excel™ or Google Sheets™ and years of data. Learn how to use standard deviation, mean or median to interpret data. Choose the best graphs to display conclusions in an infographic. Works great for science fairs! ✔ Includes an infographic project! (Template, expectations, and rubric). ✔ Everything is fully editable and you and your students can even use the images
Grades:
9th - 12th
Types:
CCSS:
Showing 1-24 of 226 results


