
Line Graphs Center Activities


- Zip
Also included in
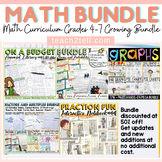 Are you looking for a comprehensive Math Curriculum bundle that includes a variety of resources and activities that cover 4th Grade, 5th Grade, and 6th Level standards?This Math Curriculum Bundle has a range of print and digital resources to teach and reinforce key math concepts aligned to the stanPrice $58.50Original Price $116.10Save $57.60
 The graphing bundle features interactive activities for creating and interpreting bar graphs, pictographs, line graphs, line plots and pie charts. Your entire graphing unit for a year!Separate folders featuring both British English and US spellings and terminology included.Great quality and value foPrice $25.00Original Price $34.60Save $9.60
 Line Graphs and Line Plots with fractions and whole numbers feature interactive center activities. Data is collected using concrete materials such as visuals, dice, spinners, coins and other real-life objects and contexts. Further details about the graphs featured in this bundle are:1. LINE GRAPHSTPrice $12.50Original Price $16.60Save $4.10
Description
Have your students graph and interpret data in line graphs with these fun center interactive activities. There are 8 line graph center activities (blackline and color) in this pack. Students will collate, interpret and plot data in line graphs.
Both British English and US spellings and terminology included.
Items Included
- 8 center Activities (color and blackline): for each center activity students will follow the instructions on a task card to plot data on a line graph and interpret data plotted on a response sheet
- Vocabulary/ mathematical terminology cards display
- Line Graph Poster/Anchor Chart
- Center Checklist
Items Included For Each Line Graph Center Activity
- File folder cover (2 options): if placing all items in a file at a center
- Single large task card (color and blackline) on a sheet outlining the task
- Two small task cards (color and blackline) on a sheet outlining the task
- Line graph sheet to plot data (single- large and two small on a sheet)
- Response Sheet to interpret data (single- large and two small on a sheet)
- 8-12 visual data cards
- Sample Response /Answer Key (single- large and two small on a sheet)
The Line Graph center activities are:
- Chocolate Fundraiser
- Hotdog Sales
- Temperature Blues
- Growing Charts
- Sprouting Forth
- Diet Trial
- Test Scores
- Pedro's Pizza (bonus)
Center Activity
- Task cards require students to interpret created graphs and target a variety of questions related to addition, subtraction and finding the mean of numbers.
- Students will follow the instructions on the task card to collect data and plot it on the line graph. They will then interpret data collected by answering questions.
* To save on paper, you have the option to print two templates on a single sheet for all printables in this pack.
Preparation
- Cut, laminate and place each set of visual cards in a zip-lock bag together with copies of the response sheet, task cards and line graph templates in a file folder.
- Use in math rotation groups or place at independent centers.
- Glue file folder cover on folder. Choice of two covers.
Also Included In
Related Resources
- Chance and Probability Bundle
- Budgeting Plans and Graphing
- Fractions Bundle
- Factors and Multiples
- Ratio and Proportion
- Mean, Median, Mode, Range
- Inequalities and Inequations
- Positive and Negative Integer Operations
- Subitizing Number Sense Building
- Place Value Bundle
- Mental Multiplication Strategies
Thank you for visiting Teach2Tell. New resources are 50% off - do follow the store to get notified :)
Please contact me with any queries regarding this resource.
Thank you!
Laurane@teach2tell.com
