57 results
Common Core HSS-ID.A.3 homework
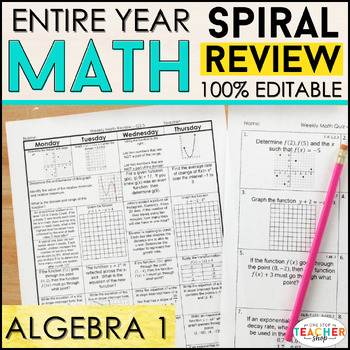
Algebra 1 Spiral Review | Homework, Algebra 1 Warm Ups, Progress Monitoring
This Algebra 1 spiral review & quiz resource can easily be used as HOMEWORK, WARM-UPS, or a DAILY MATH REVIEW! This resource was designed to keep math concepts fresh all year and to help you easily track student progress. All pages are 100% EDITABLE and easy to differentiate to fit your students' needs.⭐⭐UPGRADE for just $10 and get both PRINT & DIGITAL versions } CLICK HERE✪ CLICK HERE to see more SUBJECTS & GRADE LEVELS!★★SAVE $$ with these BUNDLES★★Algebra 1 Bundle: Spiral Review,
Subjects:
Grades:
8th - 10th
Types:
CCSS:
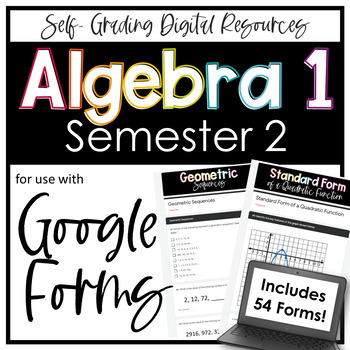
Algebra 1 Google Forms Semester 2 Digital and Printable Homework Bundle
This bundle includes all SEMESTER 2 Algebra 1 editable Google Forms homework assignments, quizzes, and tests that I have created. Every assignment also includes a "worksheet" that corresponds with the questions on each form. Just assign digitally or print + go!Not 1:1? Not using Google Classroom, yet? All of these assignments also come with a stand-alone "worksheet" that may be used with or instead of the digital resource. The SEMESTER 2 BUNDLE includes concepts within the following units:
Subjects:
Grades:
8th - 11th
Types:
CCSS:
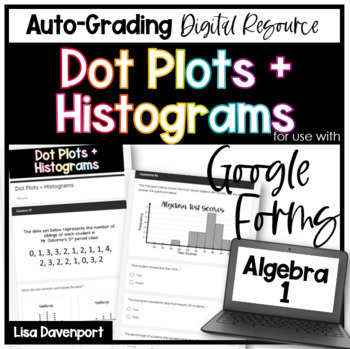
Dot Plots and Histograms Google Forms Homework
This 20-question, auto-grading Google Forms assignment provides students with practice constructing and analyzing data displayed in a dot plot or a histogram.Please note:Questions include a variety of types: "multiple-choice", "short response", "drop down", "select all that apply".Background knowledge includes mean, median, mode, range, and calculating percentages.This download also includes a PDF "worksheet" with the exact same questions as the Google Form. Just assign digitally or print + go!T
Grades:
6th - 9th
Types:
CCSS:
Also included in: Algebra 1 Google Forms Semester 2 Digital and Printable Homework Bundle
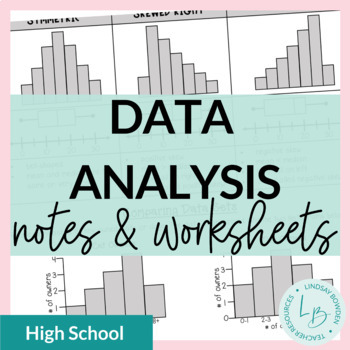
Data Analysis: Shape, Center, and Spread Notes and Worksheets
These data analysis notes and worksheets compare two data sets with regards to shape, center, and spread of data.They cover:comparing data of two sets using histograms, dot plots, box and whisker plots,and stem and leaf plotsshape (symmetrical, skewed right, skewed left)center (mean, median)peaks (mode)spread analyzing what these factors mean in context of the problem4 pages + all answer keysYou may also like:Mean, Median, and Mode Notes & WorksheetsBox and Whisker Plots Notes & Workshee
Subjects:
Grades:
8th - 10th
CCSS:
Also included in: Statistics Unit Bundle
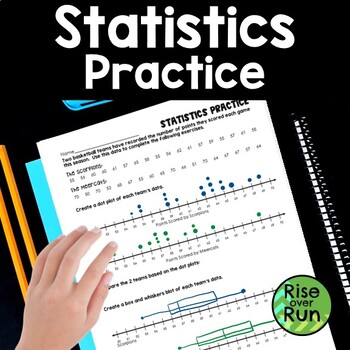
Box and Whiskers and Dot Plot Practice
Practice creating dot plots and box & whiskers plots with this statistics activity.Students are given scores for 2 basketball teams. They use the data to create a dot plot (or line plot) for each team and then a box and whiskers diagram for each team.Then, they compare the data of the teams.A bonus question asks students to calculate the mean absolute deviation.This worksheet can lead to great discussions about how to analyze box and whisker diagrams and make comparisons!
Subjects:
Grades:
6th - 7th
Types:
CCSS:
Also included in: Algebra 1 and 8th Grade Math Curriculum Bundle for Entire Year
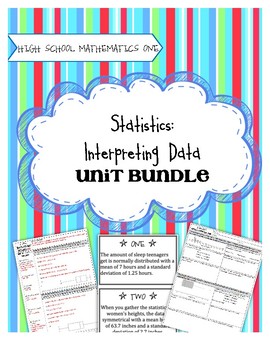
High School Math 1: Statistics and Interpreting Data
Task-Based Learning gets students intrinsically motivated to learn math! No longer do you need to do a song and dance to get kids interested and excited about learning. The tasks included in this unit, followed by solidifying notes and practice activities, will guarantee that students understand the concepts. This unit covers:
- Displaying one-variable data in a histogram, dot plot, or box plot
- Describing the distribution of data using statistical vocabulary
- Using data models and stati
Subjects:
Grades:
8th - 10th
Types:
CCSS:
High School Math 1: ENTIRE YEAR BUNDLE!
This is a $144 dollar value!
This bundle includes absolutely everything you need to teach the entire High School Math 1 year-long 9th grade course. There are 10 full units included in this bundle purchase, including all developing tasks, solidifying notes, practice activities, and assessments. These are the units included in this purchase:
Unit 1: Geometry and Rigid Transformations
Unit 2: Statistics and Interpreting Data
Unit 3: Expressions and Equations
Unit 4: Compound Inequalities and Abso
Subjects:
Grades:
8th - 10th
Types:
CCSS:
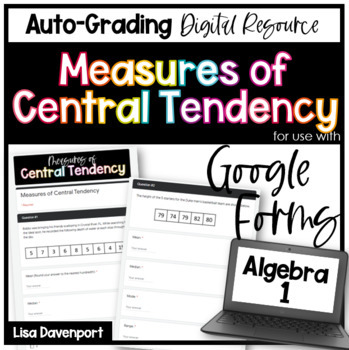
Measures of Central Tendency Google Forms Homework
This 8-question (26- part), auto-grading Google Forms assignment provides students with practice calculating and analyzing measures of central tendency. Questions are organized in the following way:#1-5: Calculate/ Find the mean, median, mode, and range.#6-7: Solve for a missing data value, when the mean is given.#8: Interpret the "best" measure of center (mean or median) and justify your answer.Most questions are "short-response" with a few "select all that apply".This download also includes a
Grades:
6th - 9th
Types:
CCSS:
Also included in: Algebra 1 Google Forms Semester 2 Digital and Printable Homework Bundle
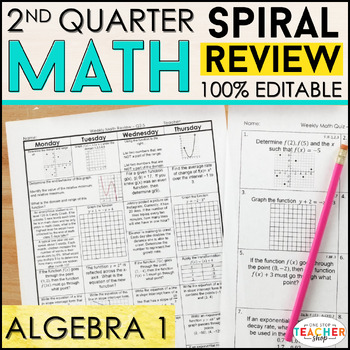
Algebra 1 Review & Quizzes | Homework or Warm Ups | 2nd QUARTER
This Algebra 1 spiral review & quiz resource can easily be used as HOMEWORK, WARM-UPS, or a DAILY MATH REVIEW! This resource was designed to keep math concepts fresh all year and to help you easily track student progress. All pages are 100% EDITABLE and easy to differentiate to fit your students' needs.☝☝ Check out the Preview for more details and 3 FREE Weeks! ☝☝Get the ENTIRE YEAR BUNDLE! {CLICK HERE}★★★★★★★★★★★★★★★★★★★★★★★★★★★★★★★★★★★★★★★★★★★★★★★★★★★★★★★★★★★★★Go 100% Paperless with my GOO
Subjects:
Grades:
8th - 9th
Types:
CCSS:
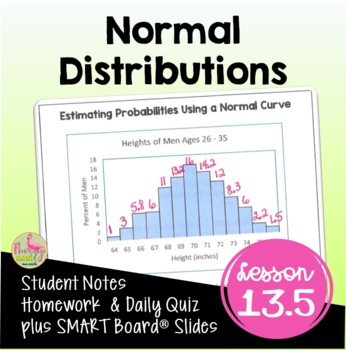
Normal Distributions (Algebra 2 - Unit 13)
Normal Distributions Algebra 2 Lesson:Your Pre-AP Algebra 2 Honors students will interpret data and make predictions using a normal distribution curve in this Unit 13 lesson. #distancelearningtptWhat is included in this resource?⭐ Guided Student Notes⭐ Google Slides®⭐ Fully-editable SMART Board® Slides⭐ Homework/Practice assignment⭐ Lesson Warm-Up (or exit ticket)⭐ Daily Content Quiz (homework check)⭐ Video Lesson Link for Distance Learning - Flipped Classroom models⭐ Full solution setStudents w
Subjects:
Grades:
8th - 11th, Higher Education
Types:
CCSS:
Also included in: Algebra 2 Curriculum Mega Bundle | Flamingo Math
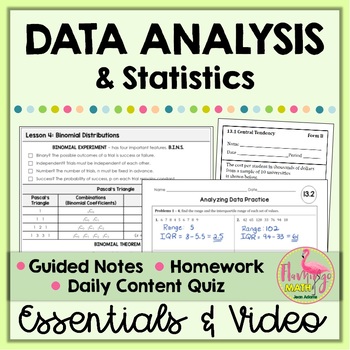
Data Analysis and Statistics Essentials (Algebra 2 - Unit 13)
Data Analysis & Statistics Essentials (Unit 13) is a complete set of GUIDED NOTES WITH VIDEO LESSONS for your distance learning needs, homework, warm-up exercises and daily content quizzes for your Algebra 2 Honors students. You will also find a set of GOOGLE SLIDES for your presentation needs.Guided Notes Format:The unit is organized into six lessons, aligned to CCSS, that will take approximately 15 instructional days. There is ample space for writing and recording knowledge in this format.
Subjects:
Grades:
8th - 11th, Higher Education
CCSS:
Statistics: Sampling Distributions
StatisticsUnit 7: Sampling DistributionsThis complete unit bundle teaches students all about the normal probability distribution, the sampling distribution for a sample proportion, the Central Limit Theorem, and the sampling distribution for a sample mean.Included in this resource:3 complete sets of student guided notesPowerPoint presentations of all the notes for easy and seamless class instruction5 homework problem sets + complete test review2 assessments – quiz and testAn in-class review less
Subjects:
Grades:
11th - 12th
Types:
CCSS:
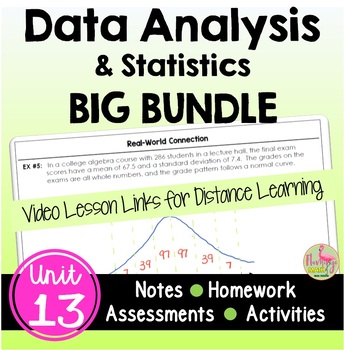
Data Analysis BIG Bundle (Algebra 2 - Unit 13)
This is a BIG Bundle of GUIDED NOTES WITH GOOGLE SLIDES and VIDEO LESSONS for your distance learning needs, homework, daily warm-up, content quizzes, mid-unit and end-unit assessments, review assignments, and cooperative activities for Algebra 2 Honors UNIT 13: DATA ANALYSIS & STATISTICS. #distancelearningtptWhat is included in each lesson?The unit is organized into SIX lessons, that will take approximately 15 instructional days.⭐ Guided Student Notes⭐ 8-Page Bound-Book Style Foldable⭐ GOOGL
Subjects:
Grades:
8th - 11th, Higher Education
CCSS:
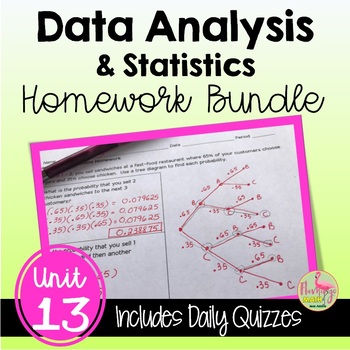
Data Analysis and Statistics Homework (Algebra 2 - Unit 13)
This is a bundle of homework and daily quizzes for Unit 13: DATA ANALYSIS & STATISTICS, designed for Algebra 2 Honors students. The file includes 17 pages of homework assignments plus two forms of a daily content quiz that you can use as a homework check, group work, or exit tickets.The unit includes the following topics:1) Measures of Central Tendency2) Analyzing Data3) Working With Samples4) Binomial Distributions5) Normal Distributions6) Confidence Intervals & Hypothesis TestingClick
Subjects:
Grades:
8th - 11th, Higher Education
Types:
CCSS:
Also included in: Algebra 2 Curriculum Big Bundle | Flamingo Math

Progress Monitoring Quizzes Bundle--MAAP Algebra I
This is a bundle of all the progress monitoring quizzes based on the MAAP (Mississippi Academic Assessment Program) Algebra I End-of-Course Assessment.These quizzes consist of 5 or fewer multiple-choice items that mirror the practice items from the MAAP State Test Practice Booklets.Check out other products in my store!
Subjects:
Grades:
9th - 12th
CCSS:
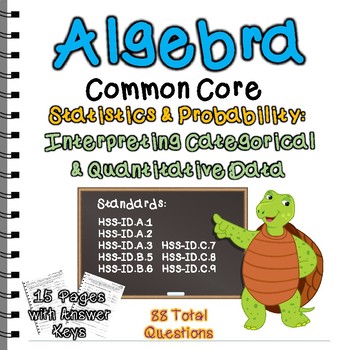
Interpreting Categorical and Quantitative Data Common Core Standards
This item is included in the following bundle:High School Algebra Common Core Standards Practice BUNDLE PACKThis item includes 8 student worksheets (7 are 2-page documents) by common core standard. There are a total of 15 pages containing 88 questions.Standards in this document are from the Probability & Statistics Standards:HSS-ID.A.1: Represent data with plots on the real number line (dot plots, histograms, and box plots).HSS-ID.A.2: Use statistics appropriate to the shape of the data
Grades:
7th - 12th
CCSS:
Also included in: High School Algebra Common Core Standards Practice BUNDLE PACK
Common Core Math 1: Stats Notes, Activity, WS: St. Deviation/Effect of Outliers
This document is focused on teaching standard deviation and the effects of outliers on the mean, standard deviation, range, and interquartile range. It contains guided notes with an answer key, a whiteboard basketball activity, and a practice worksheet with answer key. Here is the entire statistics unit for only $10.99!!Link-Common Core Math 1: Statistics Unit Bundle-5 Days of Lesson Plans!Here are other individual lesson plans on statistics:Link-Common Core Math 1:Stats Notes/Worksheet: Mean
Subjects:
Grades:
8th - 10th
Types:
CCSS:
Shapes of Data Distributions Worksheet
Attention math teachers! Are you looking for an easy and effective way to teach your students how to describe distributions in statistics? Look no further! This comprehensive worksheet on "Describing Distributions" is here to help.This worksheet covers all the important concepts of describing distributions, including measures of central tendency, identifying outliers, describing the shape as skewed left, skewed right, or roughly symmetric. With great practice problems, your students will master
Subjects:
Grades:
9th
Types:
CCSS:
Also included in: Algebra Math Riddle Worksheets
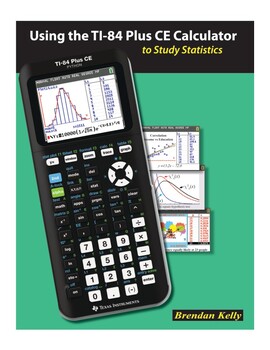
Using the TI-84 Plus CE Graphing Calculator to Study Statistics
Using the TI-84 Plus CE Calculator to Study StatisticsISBN 978-1-895997-59-0(102 pages; 8.5” x 11” trim size)The information age has made statistics one of the most important branches of mathematics. The ubiquity of real-world data enables us to explore statistical concepts using real data from interesting and current sources. As they work through the exercises in this book, students enter real data onto spreadsheets or into statistical plots on the TI-84 Plus CE Calculator while you guide their
Subjects:
Grades:
10th - 12th, Higher Education
Types:
CCSS:
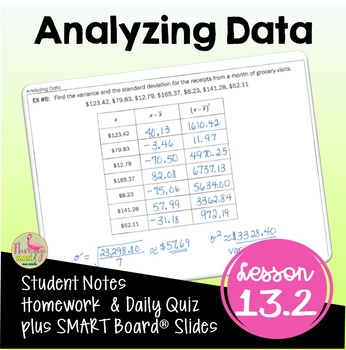
Analyzing Data (Algebra 2 - Unit 13)
Analyzing Data Algebra 2 Lesson:Your Pre-AP Algebra 2 Honors students will find range, interquartile range, standard deviation, variance, and z-scores in this unit 13 lesson on Data Analysis & Statistics that cover the concepts in depth. #distancelearningtptWhat is included in this resource?⭐ Guided Student Notes⭐ Google Slides®⭐ Fully-editable SMART Board® Slides⭐ Homework/Practice assignment⭐ Lesson Warm-Up (or exit ticket)⭐Daily Content Quiz (homework check)⭐ Video Lesson Link for Distanc
Subjects:
Grades:
8th - 11th, Higher Education
Types:
CCSS:
Also included in: Algebra 2 Curriculum Mega Bundle | Flamingo Math
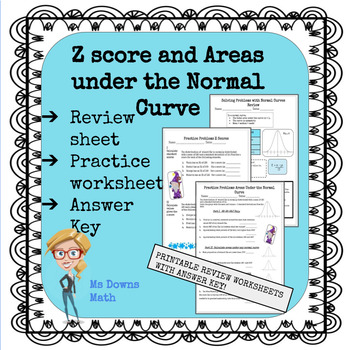
Z Scores and Normal Curves Review and Practice
These files provide students with a review of the Normal Distribution, 68-95-99.7 rule, z scores, finding area under normal curves and finding values when the area is known. The first two handouts are summaries of the topics with examples and notes. There are two practice worksheets for students and answer keys. All worksheets have a magical theme of wizards and unicorns just for fun!
Subjects:
Grades:
7th - 12th
Types:
CCSS:
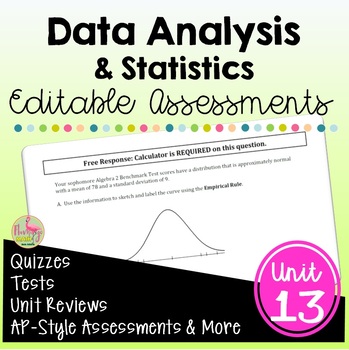
Data Analysis and Statistics Assessments (Algebra 2 - Unit 13)
Data Analysis & Statistics Assessments Bundle:This resource is a full unit of assessments for Algebra 2 Honors Unit 13: Data Analysis and Statistics. The product contains both a mid-unit reivew and an end-unit review assignment, two quizzes, and four unit tests. There is also one editable version for every review assignment, quiz and test to help you meet your personal assessment needs in your district or state.All keys are full solution sets and are included in the product.TABLE OF CONTENTS
Subjects:
Grades:
8th - 11th, Higher Education
Types:
CCSS:
Also included in: Algebra 2 Curriculum Mega Bundle | Flamingo Math
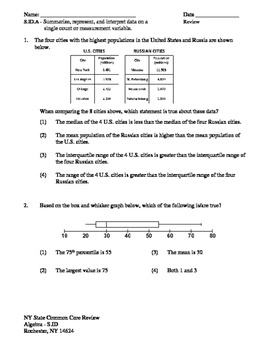
NY Regents Exam Common Core Algebra - Statistics Review Packet
This review packet has 26 part I, II, III, and IV questions that have been modeled from actual questions from previous NY Common Core Algebra Exams. This isn't a major publishers attempt at using old questions that often don't align to the actual standard. The questions breakdown is
S.ID.A
7 Part 1 Multiple Choice
1 Part 2 Short Answer
S.ID.B
2 Part 1 Multiple Choice
4 Part 2 Short Answer
2 Part 4 Short Answer
S.ID.C
3 Part 1 Multiple Choice
1 Part 2 Short Answer
4 Part 4 Short Answer
The
Subjects:
Grades:
9th
Types:
CCSS:
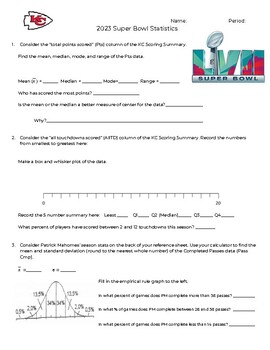
2023 Super Bowl Statistics Activity
This activity contains two stats sheets - one for the Philadelphia Eagles and one for the Kansas City Chiefs. Students are asked to use the data from the various tables to answer questions about the teams. This activity covers 1 variable statistics (mean, median, mode, range, standard deviation, box-and-whisker plot, histogram, two-way tables).This would be great as a partner activity or class activity.
Subjects:
Grades:
7th - 12th
Types:
CCSS:
Showing 1-24 of 57 results

