31 results
Common Core HSS-ID.A.3 interactive notebooks
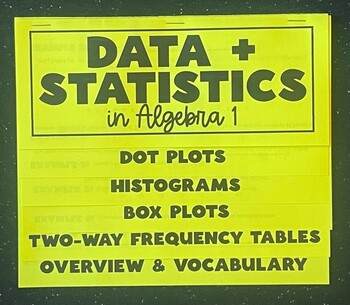
Data and Statistics in Algebra 1 Foldable Notes - Fully Editable
This editable algebra 1 foldable provides an introduction and overview for most of the univariate and bivariate data and statistics taught in the Algebra 1 standards. It is organized by the following tabs:Dot PlotsHistogramsBox PlotsTwo-Way Frequency TablesOverviewWithin the foldable there are at least two examples for each type of graph. It also allows for you to review/ address the following terms: mean, median mode, range, interquartile range, outliers, standard deviation, marginal and joi
Grades:
8th - 10th
CCSS:
Also included in: Data Analysis and Statistics Foldable Bundle
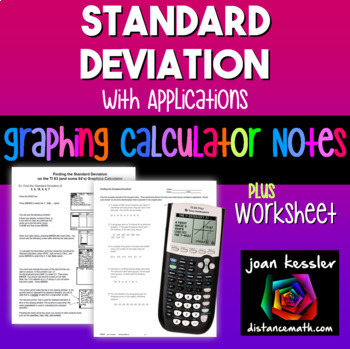
Standard Deviation on TI-84 Reference Sheets plus Practice
With this Determining the Standard Deviation on the TI 83 TI 84 Graphing Calculator plus HW step by step reference sheet your students will learn to use the graphing calculator effectively in finding the standard deviation from a data set. Use as Binder Notes or printed smaller for Interactive Notebooks.What's included?Two reference/handouts for students to learn how to find the Standard Deviation for both a population and for sample. One is for the TI 83 (yes, still in use) and the other for th
Subjects:
Grades:
8th - 11th
CCSS:
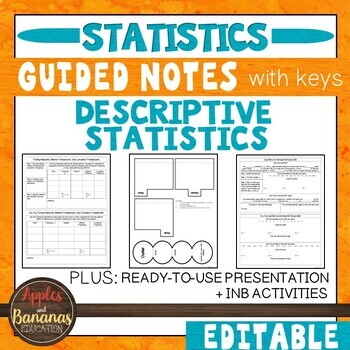
Descriptive Statistics- Guided Notes, Presentation, and INB Activities
This Introduction to Statistics product is flexible, editable, and can be used for in-person or distance learning. Take the time and stress out of creating your own guided notes and presentations. There are many ways to use this engaging bundle. It includes guided notes embedded with student practice problems (keys included), foldable activities, and a PowerPoint presentation for focused instruction. Choose what works best for your class/student and modify to make the content fit your needs. Not
Subjects:
Grades:
9th - 12th
CCSS:
Also included in: Custom Bundle for Viet
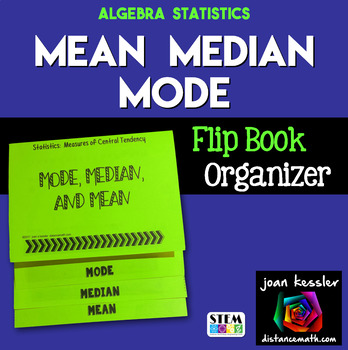
Measures of Central Tendency Foldable Flip Book
This Measures of Central Tendency Foldable Flip Book is a great way for your students to study the Mean, Median, and Mode . Students complete definitions plus 13 problems organized by type. All of the problems are applications.Each Foldable Flip Book requires only one sheet of 8½” by 11” paper. Easy to assemble - no glue, no tape, no mess. Easy to follow directions included as well as the Answer key. Final dimensions 5.5” x 5”. Please note: Two sided printing required._______________________
Subjects:
Grades:
7th - 10th
CCSS:
Also included in: Algebra Foldables and Organizers Bundle
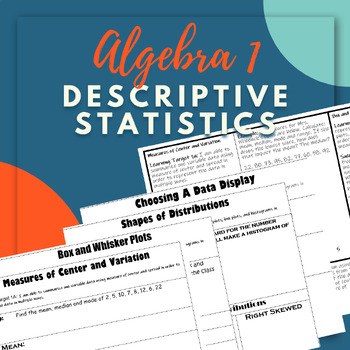
Descriptive Statistics Notes and Student Reflection Bundle
This bundle includes all notes outline from my Descriptive Statistics Unit. The topics include: Measure of Center and Variation, Box and Whisker Plots, Shapes of Distributions and Choosing a Data Display. It also includes my student reflection page that has learning targets, success criteria, opportunities for student self assessment and reflection that align with my notes outlines. All documents are in Microsoft Word, so that you can edit to meet your needs!
Subjects:
Grades:
9th - 12th
CCSS:
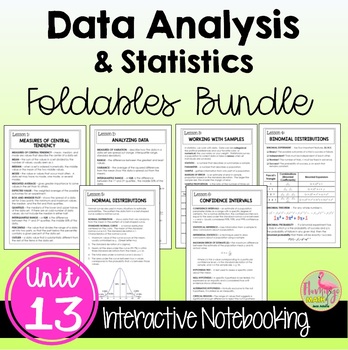
Data Analysis and Statistics FOLDABLES™ (Algebra 2 - Unit 13)
This bundle of 8-page Bound-Book-Style Foldables includes six lessons on topics in UNIT 13: Data Analysis & Statistics for your Algebra 2 Honors students. A set of finished notes and directions for creating the Foldables are also included.⭐ Bonus: A set of Google Slides for presenting the lesson and video lesson links are now included for distance learning and flipped classroom methods.☆FOLDABLESThree options of an 8-page Bound-Book Foldable® will help with differentiation.Option #1: All voc
Subjects:
Grades:
8th - 11th, Higher Education
CCSS:
Also included in: Algebra 2 Curriculum Big Bundle | Flamingo Math
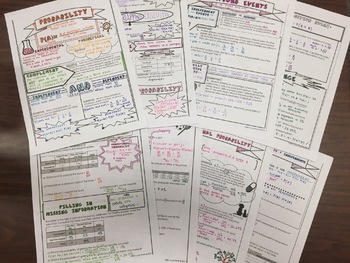
Interactive Probability Notes
This bundle includes 4 different interactive notes for: overall probability vocab, compound events, probability models, and conditional probability. Also included are two "cheat sheets" for students to have in interactive notebooks: one for probability symbols and one for the basics of a deck of cards.
Subjects:
Grades:
9th - 12th
CCSS:
Displaying Data notes Histogram Box Plot Dot Plot Stem and leaf plot
Guided notes for descriptive statistics and displaying data includes bar graph, histograms, dot plots, box plots (aka box and whisker plot), and stem-and-leaf plots. This is Unit 1: lesson 3 in the AP Statistics Curriculum.Included in this resource:Interactive notebook pages graphic organizersGuided notes Practice ("try it") pages for individual or partner work NotesAnswer keyTopics included:Construct and analyze a bar graphConstruct and analyze a histogramBar graph vs histogramConstruct and an
Subjects:
Grades:
9th - 12th
CCSS:
Also included in: Descriptive Statistics AP Statistics
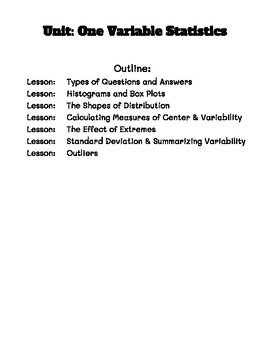
One Variable Statistics Unit, Student Notes
If you have taught One-Variable Statistics to Algebra students before, you know it can be a tough one! Here you will find a set of student notes for support in understanding the Algebra 1, One-Variable Statistics Unit.These are great to print and tape into student journals, post for students when absent, or use as a teacher guide when sharing notes in a whole class setting. In this document you will find the following topics:1. Types of Questions and Answers2. Histograms and Box Plots3. The Shap
Subjects:
Grades:
8th - 10th
CCSS:
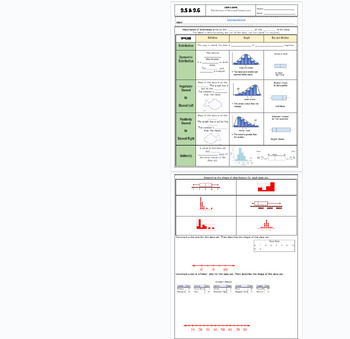
Data Distribution positive/negative skewed fillable notes UPDATED
Unit 9: Data and Stats: Updated(No 9.3/ Skip)9.5/9.6 Data Distribution (skewness)Students go over the vocabulary and complete the examples with the vocabulary scaffolded. Skewness is explained and how to identify it comparing data charts and box and whisker plots. Uses many visuals and examples to differentiate between that different graphs. Notes are scaffolded. Includes hook video hyperlinked on the "learning objective" title. Key is included and hyperlinked as a PDF in the heading highlighted
Subjects:
Grades:
6th - 12th, Higher Education, Adult Education
CCSS:
Also included in: Unit 9: Data and Statistics Fillable Notes
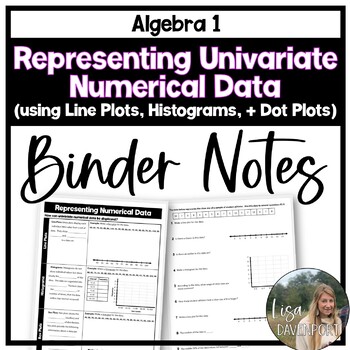
Representing Univariate Numerical Data - Binder Notes for Algebra 1
This set of algebra 1 binder notes provides the teacher and students with guided notes on univariate numerical data representations, including: line plots, histograms, and box plots. The front side is the "notes", where students will complete the definitions and construct each of the types of graphs. The back side includes another set of data for students to practice constructing and analyzing all three types of graphs again.This resource is included in the following bundles:★ Algebra 1 Binder
Subjects:
Grades:
7th - 9th
CCSS:
Also included in: Algebra 1 Editable Binder Notes Bundle for the Entire Year
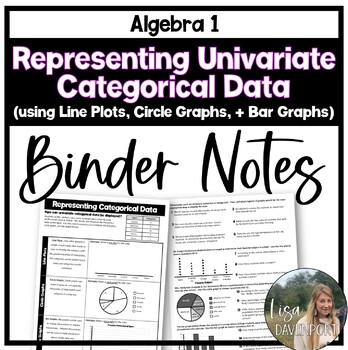
Representing Univariate Categorical Data - Binder Notes for Algebra 1
This set of algebra 1 binder notes provides the teacher and students with guided notes on univariate categorical data representations, including: line plots, circle graphs, and bar graphs. The front side consists of the "notes", where students are given the definitions and will construct each of the graphs, given the data in a frequency table. On the back side, students will practice differentiating between numerical and categorical data and determining the best type of graph, then analyze dat
Subjects:
Grades:
7th - 9th
CCSS:
Also included in: Algebra 1 Editable Binder Notes Bundle for the Entire Year
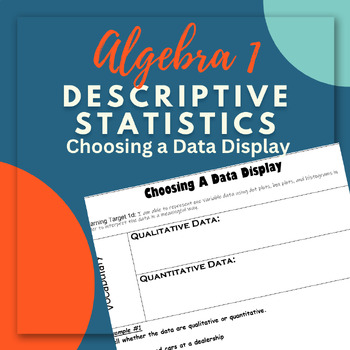
Choosing a Data Display
This is an editable copy of a notes outline for Algebra 1. This outline is designed to be used within the Descriptive Statistics Unit. These notes cover choosing the best way to display your data and misleading graphs that can create bias. Check out my other notes outlines and my student reflection tools that align with the notes for each unit!
Subjects:
Grades:
9th - 12th
CCSS:
Also included in: Descriptive Statistics Notes and Student Reflection Bundle
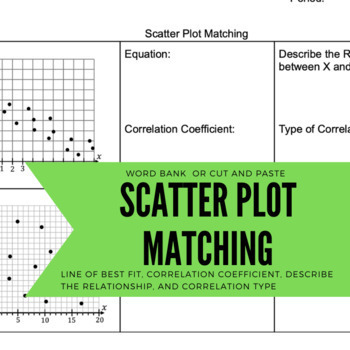
Scatter Plot, Best fit line, and Correlation Coefficient matching activity
Matching or cut and paste activity and worksheet. Students match equations of best fit lines, correlation coefficients, type of correlation, and sentence describing the relationship with 8 scatter plots.
Subjects:
Grades:
7th - 12th
Standard Deviation Fillable Notes UPDATED
Unit 9: Data and Stats: Updated(No 9.3/ Skip)9.4 B Standard DeviationStudents go over the vocabulary and complete the examples with the vocabulary scaffolded. Standard deviation is long hand calculated by showing each step of the process (difference of squares). Real-world examples are explained in notes before calculating to show the importance of this stat and why it is used so often to verify valuable and effective data. Notes are scaffolded. Includes hook video hyperlinked on the "learning o
Subjects:
Grades:
7th - 12th, Higher Education, Adult Education
CCSS:
Also included in: Unit 9: Data and Statistics Fillable Notes
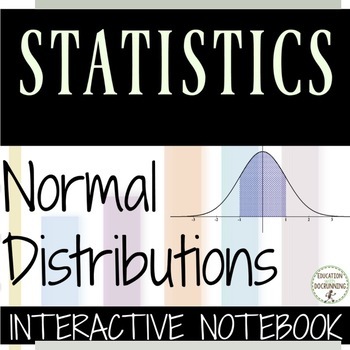
Normal Distribution Notes with z scores Statistics
These notebook pages and notes for Using Normal Distributions are great for Algebra 2 and Statistics students. Choose from color or black and white notebook pages. This is the 3rd lesson in Algebra 2 Unit 11 Data Analysis and Statistics . Included resources in this bundle:- Color-coded notebook pages- Black and white notebook pages- Answer KeyTopics included in Unit 11 Algebra 2 Data Analysis and Statistics:- Central tendency - Applying Transformations of Data- Normal Distributions - Selecting
Subjects:
Grades:
10th - 12th
CCSS:
Also included in: Algebra 2 Curriculum
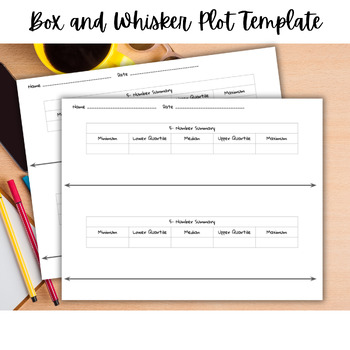
Box Plot Template | Box and Whisker Plot Template | Graphing Template
Box and Whisker Plot TemplateSay goodbye to data confusion and hello to organized insights with our Box Plot Template! This tool simplifies data organization with a five-number summary and a ready-to-use number line, so students can jump right into visualizing data distributions.With two box plots on one paper, students can easily compare data, spot outliers, identify medians, quartiles, and more - all at a glance!
Subjects:
Grades:
8th - 12th
CCSS:

Survey Project - Digital Google Slides Assignment
This project requires students to:- Create a numerical and categorical statistical question- Predict and hypothesis the results they will receive- Think about how they will set up and send out their survey- Survey 25 individuals and interpret their results. - Calculate Mean and Standard Deviation- Create charts on Google Sheets- Discuss results- Discuss possible improvementsThis project could take up to a week for students to complete depending on how you set it up in your classroom.One thing yo
Subjects:
Grades:
7th - 12th
CCSS:
Measures of Center - EDITABLE Slides, Notes, INB & Test+++ Drive Math
Drive Instruction with instructional resources that live in the cloud on Google Drive! All of the docs are COMPLETELY EDITABLE and can be differentiated to meet your needs or the needs of your students. PDFs are also included in the download if you prefer them that way. Each Drive Instruction set includes warm-ups, exit tickets, notes, presentations, digital interactive notebooks and tests. These are designed to be complementary to all of my innovative supplemental resources and an improvement o
Subjects:
Grades:
6th - 10th
Also included in: Measures of Center & Variance Unit Bundle - Distance Learning Compatible
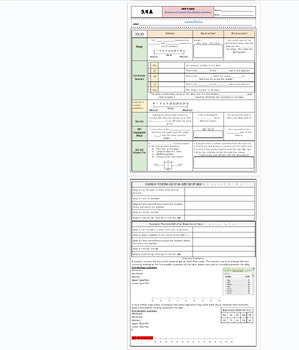
5 Number Summary and Box and Whisker Plots Fillable Notes UPDATED
Unit 9: Data and Stats: Updated(No 9.3/ Skip)9.4 A 5-number summary and box and whisker plot Students go over the vocabulary ad complete the examples with the vocabulary scaffolded. for each statistic with an explanation of the purpose of the 5 number summary and why these are used. Notes are scaffolded. Includes hook video hyperlinked on the "learning objective" title. Key is included and hyperlinked as a PDF in the heading highlighted in the orange box, and at the bottom of the google doc as w
Subjects:
Grades:
6th - 12th, Higher Education, Adult Education
CCSS:
Also included in: Unit 9: Data and Statistics Fillable Notes
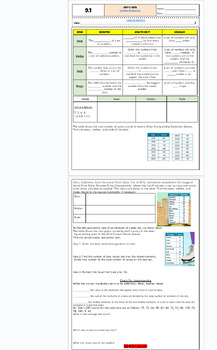
Central Tendencies: Mean, Median and Mode fillable notes: Updated
Unit 9: Data and Stats Updated9.1 Central Tendencies: mean median and modeStudents go over the vocabulary and how to find each average with examples. Notes are scaffolded. Includes hook video hyperlinked on the "learning objective" title. Key is included and hyperlinked as a PDF in the heading highlighted in the orange box, and at the bottom of the google doc as well. Google doc is editable, used in M1 HS
Subjects:
Grades:
6th - 12th, Higher Education, Adult Education
CCSS:
Also included in: Unit 9: Data and Statistics Fillable Notes
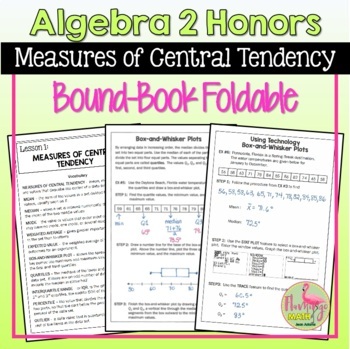
Measures of Central Tendency Foldable
Measures of Central Tendency Foldable:This 8-page Bound-Book-Style Foldable is designed for students enrolled in Algebra 2 Honors with a general knowledge of basic probability. Your students will love this mini-booklet they create for the first lesson in the unit on Data Analysis and Statistics.***(4/14/2022) Revised the key for EX #7 to correct the 35th percentile is 61.Learning Objectives:★ Calculate measures of central tendency★ Draw, analyze, and interpret box-and-whisker plots★ Find outlier
Subjects:
Grades:
8th - 11th
CCSS:
Also included in: Data Analysis and Statistics MEGA Bundle (Algebra 2 - Unit 13)
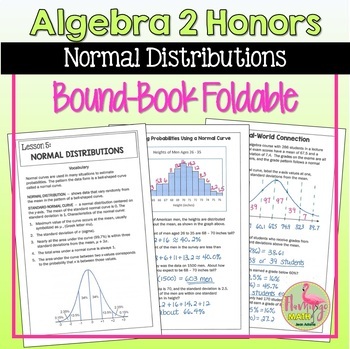
Normal Distributions Foldable (Unit 13)
Normal Distributions Foldable:This 8-page Bound-Book-Style Foldable is designed for students enrolled in Algebra 2 Honors with a general knowledge of basic probability. Your students will love this mini-booklet they create for the fifth lesson in the unit on Data Analysis and Statistics.Learning Objectives:★ Interpret data by using a normal distribution★ Interpret data by using the standard normal curve★ Calculate standard deviations when outcomes are normally distributed and analyze real-world
Subjects:
Grades:
8th - 11th
CCSS:
Also included in: Data Analysis and Statistics MEGA Bundle (Algebra 2 - Unit 13)
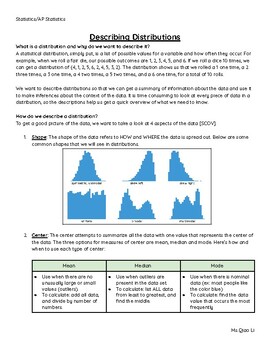
Graphic Organizer and Info Sheet for Describing Distributions: AP Statistics
Ae your students struggling with describing statistical distributions on their free responses? This document includes a cheat sheet, info sheet, graphic organizer, and sentence stems that students can use to craft their responses for a 4 (at least on that question) on their responses. It includes example responses. This is aligned to the AP Statistics Exam and can be used for Introduction to Statistics too. It is accommodated for students with IEPs or in need of language supports. This can be pr
Subjects:
Grades:
9th - 12th, Higher Education
CCSS:
Showing 1-24 of 31 results

