10 results
Common Core HSS-ID.A.3 research

The Great Stock Market Challenge - Complete Math Unit
Suitable and adapted for grades 5-12Open the Preview to see more detailed informationWatch the movie to see a high speed play through of the presentationThis complete cross-curricular unit has students learn about companies, research stocks, create a portfolio, track their performance, submit their project and write a test. Students will learn about real life financial literacy, trade-offs, decision making, strategies, and apply mathematical concepts.The unit runs about 10-14 weeks long, with an
Subjects:
Grades:
5th - 12th
Types:
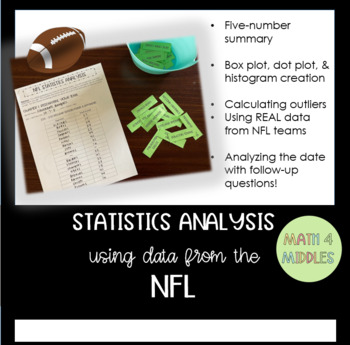
One Variable Statistics Review: Analyzing NFL Scores
**UPDATED for the 2022-2023 season!**Students are ALWAYS asking "when will I ever see/use this in my life?" This activity provides an opportunity for students to analyze an NFL team's scores from the 2022-2023 regular season. It provides a more engaging way for student to review one-variable statistics and reflect on what they find out about their team.4 quarters of work included + an "overtime":Quarter 1: Researching your team (record hunting)Quarter 2: Stats analysis (five-number summary, me
Grades:
8th - 9th
Types:
CCSS:
6 Editable Bar Graph Templates 2.0
Finally a simple and professional graph space that students can fill out without any design issues getting in the way. This file contains 6 ready-to-use graph options. Print them and have students fill them with pencil and ruler, or distribute them over computer and let them practice entering the data. Get a project perfect finish every time. Maybe you just want to fill it out live on a projector? The possibilities are endless! It's okay to say you love these bar graphs. So do we.Contains:- 2 bl
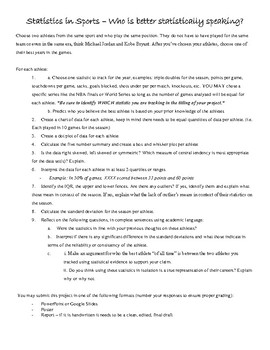
Statistics in Sports - Who is better statistically speaking?
Give students the unique opportunity to explore athletes from any sport, peak their interest, and engage with one variable statistics in a meaningful way. Just create a quick rubric based on your grading practices and let them SOAR!
Suggested to have students claim their athletes or sports events in advance to avoid too many duplicates, especially if students will be presenting their findings.
Subjects:
Grades:
8th - 10th
CCSS:
Passion-Driven Statistics E-book (Introductory/AP Statistics Course Textbook)
Passion-Driven Statistics is an NSF-funded, multidisciplinary, project-based curriculum that supports students in conducting data-driven research, asking original questions, and communicating methods and results using the language of statistics. The curriculum supports students to work with existing data covering psychology, health, earth science, government, business, education, biology, ecology and more. From existing data, students are able to pose questions of personal interest and then use
Subjects:
Grades:
6th - 12th, Higher Education, Adult Education
Types:
SPSS software Secondary Data Analysis Workshop (Introductory/AP Statistics)
This handout is intended for those interested in teaching/learning basic introductory statistics concepts to analyze real data. Students will learn how to tell a story using secondary data analysis. The handout is for SPSS and the US Longitudinal Study of Adolescent Health data set. For handouts on the data set code book and raw data file, a PowerPoint to accompany the handout, or questions please email kristin.flaming@gmail.com or ldierker@wesleyan.edu.This handout was developed as a condensed
Subjects:
Grades:
6th - 12th, Higher Education, Adult Education
Types:
Translation Code
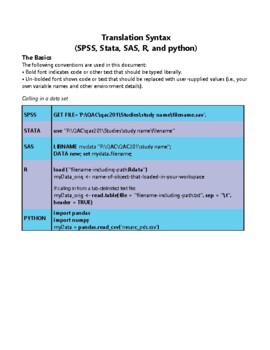
As part of our NSF-funded passion-driven statistics project, we have just started to share more widely our “translation code” aimed at supporting folks in learning code-based software and in moving more easily between them. The pdf includes all of the basic syntax for managing, displaying and analyzing data, translated across SAS, R, Python, Stata and SPSS. http://bit.ly/PDSTranslationCode.For more information about our warm and welcoming data-driven curriculum, check out https://passiondrivenst
Grades:
6th - 12th, Higher Education, Adult Education
Types:
R software Secondary Data Analysis Workshop (Introductory/AP Statistics)
This handout is intended for those interested in teaching/learning basic introductory statistics concepts to analyze real data. Students will learn how to tell a story using secondary data analysis. The handout is for R or R Studio, a free cloud based system and the US Longitudinal Study of Adolescent Health data set. For handouts on setting up a free R account, the data set code book and raw data file, a PowerPoint to accompany the handout, or questions please email kristin.flaming@gmail.com or
Subjects:
Grades:
6th - 12th, Higher Education, Adult Education
Types:
STATA software Secondary Data Analysis
This handout is intended for those interested in teaching/learning basic introductory statistics concepts to analyze real data. Students will learn how to tell a story using secondary data analysis. The handout is for STATA software and the US Longitudinal Study of Adolescent Health data set. For handouts on setting up an account, the data set code book and raw data file, a PowerPoint to accompany the handout, or questions please email kristin.flaming@gmail.com or ldierker@wesleyan.edu.This
Grades:
6th - 12th, Higher Education, Adult Education
Types:
SAS software Secondary Data Analysis Workshop (Introductory/AP Statistics)
This handout is intended for those interested in teaching/learning basic introductory statistics concepts to analyze real data. Students will learn how to tell a story using secondary data analysis. The handout is for SAS (email for R, SPSS, Stata, & Python), a free cloud based system and the US Longitudinal Study of Adolescent Health data set. For handouts on setting up a free SAS account, the data set code book and raw data file, a PowerPoint to accompany the handout, or questions please e
Grades:
6th - 12th, Higher Education, Adult Education
Types:
Showing 1-10 of 10 results

