16 results
Common Core HSS-ID.A.3 centers
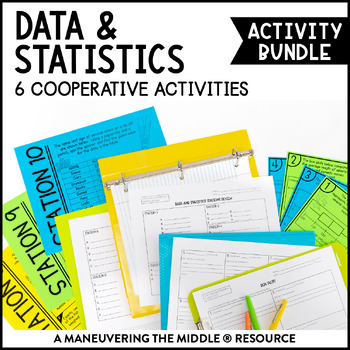
Data and Statistics Activity Bundle | Dot plot, Histogram, & Box Plot Activities
This Data and Statistics Activity Bundle for Algebra 1 includes activities to support mean, median, mean average deviation, standard deviation, dot plots, histograms, box plots, and two-way tables.These hands-on and engaging activities are all easy to prep! Students are able to practice and apply concepts with these data and statistics activities, while collaborating and having fun! Math can be fun and interactive!Standards: CCSS (S.ID.1, S.ID.2, S.ID.3, S.ID.5) More details on what is included:
Grades:
8th - 9th
Types:
CCSS:
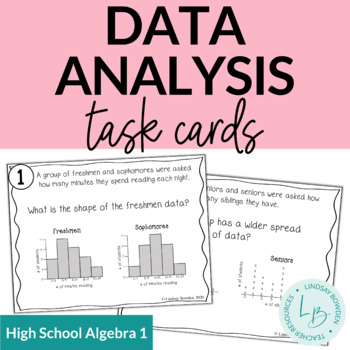
Data Analysis: Spread, Center, and Shape Task Cards
The digital version of this resource for Google Drive™ using Google Forms can be found here: Distance Learning: Data Analysis Digital Task Cards. You are able to edit this assignment using Google Forms and assign it to your students via Google Classroom.These data analysis task cards includes:comparing data of two sets using histograms, dot plots, and box and whisker plotsshape (symmetrical, skewed right, skewed left)center (mean, median)peaks (mode)spread (from looking at the graph)12 task card
Subjects:
Grades:
8th - 10th
Types:
CCSS:
Also included in: Statistics Unit Bundle
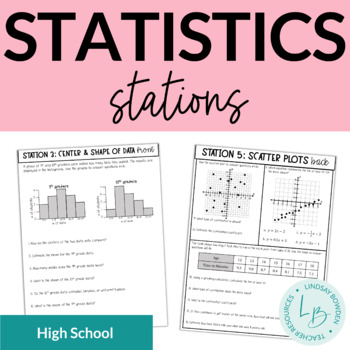
Statistics Stations
These statistics stations have 5 front and back stations that cover:histograms and dot plotstwo-way frequency tablescenter and shape of data (central tendency, peaks, symmetrical or skewed)spread of data (range, IQR, MAD)scatter plots (correlation, line of best fit, linear regression)Includes a student answer sheet and answer keys!Check out my YouTube video on stations here!You may also like:Box and Whisker Plots Notes & WorksheetsHistograms Notes & WorksheetsScatter Plots Notes and Work
Subjects:
Grades:
8th - 10th
Types:
CCSS:
Also included in: Statistics Unit Bundle
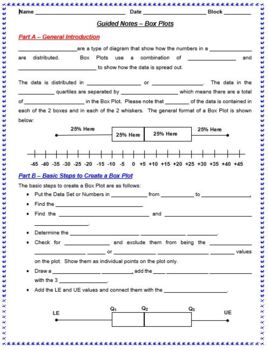
Guided Notes - Statistics Bundle (Box, Line & Scatter Plots, Histograms, Etc.)
This MS Word file is a bundle of 6 separate Guided Notes documents that review both the concept and steps involved in various statistical measures, plots and diagrams. The following Guided Notes documents are included in this bundle:Box PlotsLine PlotsHistogramsMeasures of Central TendencyScatterplots and Line of Best FitScatterplots and CorrelationThese individual Guided Notes documents have been bundled together to provide teachers with a single, complete, discounted package of 6 of the basic
Subjects:
Grades:
8th - 11th
CCSS:
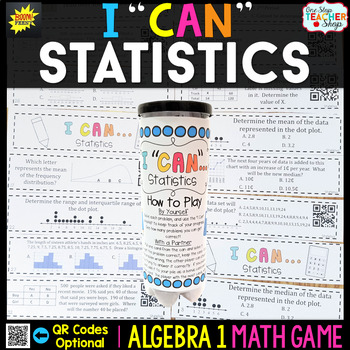
Algebra 1 Game | Statistics
Statistics have never been this much fun! This Algebra 1 I Can Math Game focuses on statistics, and provides students with practice in the form of multiple choice or short answer questions. QR codes (optional) make this game even more interactive as students get immediate feedback on their work with self-checking! This game can also be used for independent practice, small group activity, whole group review, or for progress monitoring. The possibilities are endless.With QR Codes!Here is a list o
Subjects:
Grades:
8th - 10th
Types:
CCSS:
Also included in: Algebra 1 Games BUNDLE - Math Test Prep Review
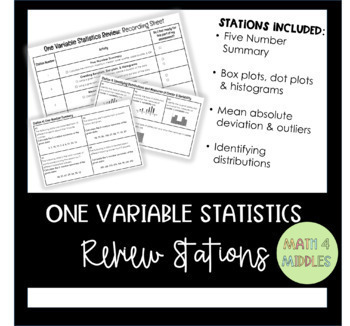
One Variable Statistics: Stations Review
Stations are a great way for students to practice skills or review for an upcoming assessment! Use this resource for your Algebra 1 students to review everything about one variable statistics.Station Topics Included:Five-Number SummaryCreating Boxplots, Dot plots, & HistogramsMean Absolute Deviation & OutliersIdentifying DistributionsTerms of Use:This product should only be used by the teacher who purchased it. This product is not to be shared with other teachers. Please buy the correct
Subjects:
Grades:
9th
Types:
CCSS:
Statistics - Algebra Math Workshop Math Games Stations
Are you looking for Math Workshop Activities to use in your Algebra classroom for Statistics that will allow you to make the best use of your planning time and easily implement Math Workshop stations because the planning is already done for you?**Want to know more? Check out the video here to learn more about the Math Workshop Concept-Based Activities!**Within this Weekly Unit, you will find 8 activities provided for you to pick and choose, or even allow a choice among your students to determine
Subjects:
Grades:
8th - 9th
Types:
CCSS:
Also included in: 7th, 8th & Algebra Grade Math Workshop Bundle Math Stations Now®️ Games
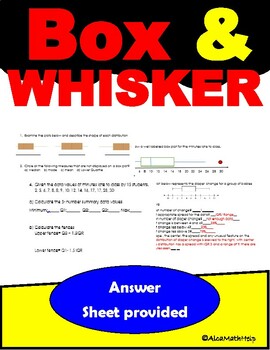
Statistics Quantitative Data Boxplots- 5 Number Summary Data CP, AP Stats
If you are looking for an activity sheet that will engage students as they aim to practice and apply taught concept this box plot activity is the one. It is excellent if you want to check students understanding while having fun. This activity helps students to describe the shape of quantitative distribution, identify centers and spreads by analyzing quartiles (measure of center and variability) . Use the SOCS method to describe the shape, center, spread and outlier as well as other unusual feat
Subjects:
Grades:
7th - 12th, Higher Education, Adult Education
Types:
CCSS:
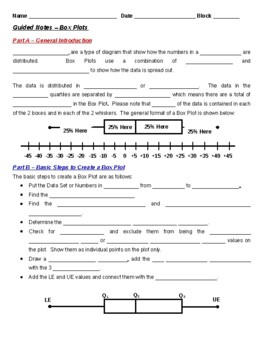
Guided Notes - Box Plots (Student & Teacher Versions)
This MS Word file is a Guided Notes document that reviews both the concept and steps involved in solving and producing Box Plots. I use these notes with my Math 1, Math 2 and Algebra 1 students immediately after I introduce this concept with my PPT presentation slidepack on the same subject. It is 2 full pages of notes for the students to complete and includes the detailed steps that I teach my students to use to solve and produce Box Plots. The 3rd page includes an example problem that is wo
Subjects:
Grades:
8th - 10th
CCSS:
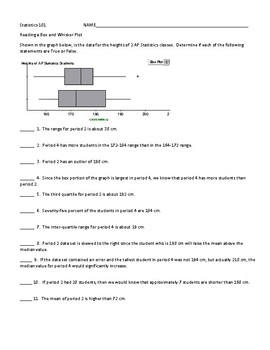
Box and Whisker Plots--11 True False Questions
Compare side by side box and whisker plots by answering 11 True/False questions.
Subjects:
Grades:
9th - 12th, Higher Education
Types:
CCSS:
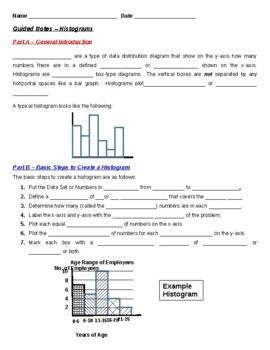
Guided Notes - Histograms (Student and Teacher Versions)
This MS Word file is a Guided Notes document that reviews both the concept and steps involved in developing Histograms. I use these notes with my Math 1, Math 2 and Algebra 1 students immediately after I introduce this concept with my PPT presentation slidepack on the same subject. It is 1-1/2 pages of notes for the students to complete and includes the detailed steps that I teach my students to use to properly develop and analyze Histograms. The 2nd page also includes an example problem that
Subjects:
Grades:
8th - 10th
CCSS:
10 Free Big Brain Math Problems
This is a sample of the 100 and 180 Big Brain Math Problem I have created with a couple of my students. I write these problems on the window of my classroom everyday and get about 5-10 students a day coming to try to solve them. It's been an enjoyable experience to have students come try the problem of the day and share their solutions with me. Please consider purchasing the 100 or 180 Big Brain Math Problems. There's enough for one a day for the entire school year and range from 1-5 Star diffic
Subjects:
Grades:
9th - 12th
Types:
CCSS:
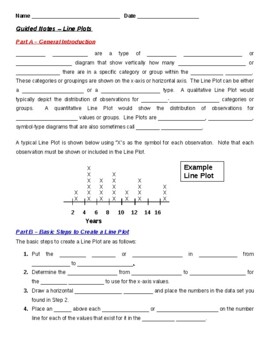
Guided Notes - Line Plots (Teacher and Student Versions)
This MS Word file is a Guided Notes document that reviews both the concept and steps involved in developing Line Plots. I use these notes with my general 8th Grade Math, Math 1, Math 2 and Algebra 1 students immediately after I introduce this concept with my PPT presentation slidepack on the same subject. It is 1-1/2 pages of notes for the students to complete and includes the detailed steps that I teach my students to use to properly develop and analyze Line Plots. The 2nd page also includes
Subjects:
Grades:
8th - 10th
CCSS:
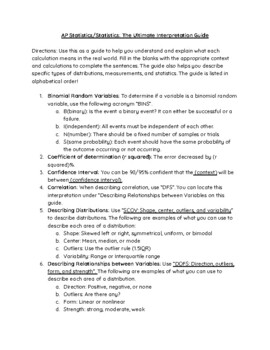
AP Statistics: Interpretations Guide: What does each statistic mean?
Hi teachers! This resource is great for your elementary, regular, or AP Statistics course. Students can use this guide all year long. We want our students to actually understand what they are calculating and connect their learning to real-world contexts! This resource will help them do just that. Some interpretations covered are mean, median, mode, and more. Here are the directions for use of the interpretations guide: Directions: Use this as a guide to help you understand and explain what each
Subjects:
Grades:
7th - 12th
CCSS:
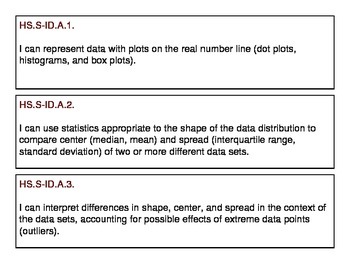
High School Probability and Statistics Concept "I Can" Statement Strips
This file contains all of the CCSS for the "Probability and Statistics" conceptual category in grades 9-12. This PDF can be printed and cut out to post for daily lessons. They will fit a pocket chart or you can add magnets to the back and display them on a magnetic whiteboard. Tabulated sections will keep your strips organized. They will fit perfectly in a file folder system or even a shoebox.
Subjects:
Grades:
7th - 12th
CCSS:
Z Table (Normal Curve) Marker Board Practice (Statistics/AP Stats)
Get ready to supercharge your students' understanding of z scores and z tables with this dynamic activity! With 34 questions and answers conveniently displayed on a PowerPoint presentation, you can easily engage your students in practicing solving z score problems and finding the probability under the z table. Perfect for Statistics and AP Statistics classes, this activity will take your students' skills to the next level and ensure they are fully prepared for any z score challenge that comes th
Subjects:
Grades:
9th - 12th
Types:
CCSS:
Showing 1-16 of 16 results

