TPT
Total:
$0.00
Selected
Subjects

Subjects

Arts & Music
English Language Arts
Foreign Language
Holidays/Seasonal
Math
Science
Social Studies - History
Specialty
For All Subject Areas
53 results

High school math handouts for Microsoft Excel
Preview of Bundle - Help with Science Fair Table, Graphs, Statistics using Excel.

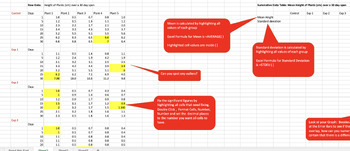
Bundle - Help with Science Fair Table, Graphs, Statistics using Excel.

Created by
LsotoTeach
This comprehensive 3-part bundle comprises a video tutorial, an informative handout, and an Excel file meticulously guiding students through a step-by-step process. The aim is to empower students with the skills to transform raw data into concise summative data tables and graphs, complete with standard deviation error bars. The tutorial covers the entire spectrum – from utilizing Excel for table and graph preparation to conducting statistical analyses using Anova tests, t-tests, or correlation m
Preview of VM Numeracy Unit 2 - Civics - Data and Uncertainty
VM Numeracy Unit 2 - Civics - Data and Uncertainty

VCE VM Unit 2 Numeracy book, Civic - Data and Uncertainty. This unit looks at odds, reading and interpreting data, probability and statistics. Includes many hands-on activities.
Preview of End of Year Survey

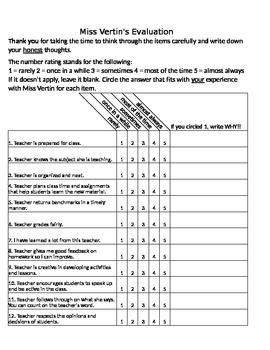
End of Year Survey

I have students fill out this survey on their last day of school. They always give me and future students great feedback.
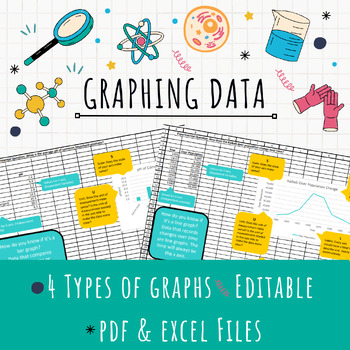
Preview of EDITABLE Excel Graphing Template

EDITABLE Excel Graphing Template

Teach graphing in Excel with this EDITABLE template! After collecting data, have your students represent it in a formal graph using Excel. This template provides helpful tips for students to determine the right kind of graph (bar, line, or pie) for their data and ALSO teaches them all the important parts of a graph.Assign the template for students to download and edit for a quick graphing solution or provide the pdf handouts for students who just need a little guidance!4 different kinds of graph
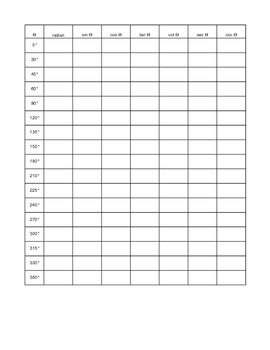
Preview of Trig Functions Blank Sheet

Trig Functions Blank Sheet

Created by
Betty Watson
Convert radians to degrees and find the six trig functions for each angle that's a multiple of 30 degrees and 45 degrees between 0 degrees and 360 degrees. Betty Watson Sin Cos Chart by Betty Watson is licensed under a Creative Commons Attribution-Noncommercial 3.0 United States License.
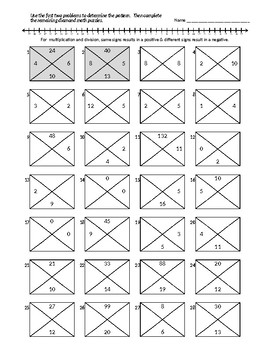
Preview of Math Diamonds - Regenerates numbers - Infinite problem set
Math Diamonds - Regenerates numbers - Infinite problem set

Full four sheets of diamond math problems. Each time you open the document, a new set of problems is generated. -Positive [0,12] -Positive [0,18] -Pos/Neg [-12,12] -Pos/Neg [-18,18] Diamond problems help students learn simple factoring of quadratic trinomials by making it seem more lake a game or a puzzle. The top and bottom numbers represent b and c in the trinomial x^2+bx+c (there can't be a coefficient on x^2), and the left and right numbers represent the numbers in the binomial factors. I
Preview of How To Graph Using Google Spreadsheets

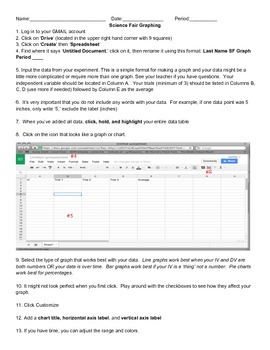
How To Graph Using Google Spreadsheets

This is a step-by-step guide on how to use Google Spreadsheets for students in grades 5-12. Use this as a resource when guiding students through the process. Included with the directions is sample data for students to use when practicing graphing. Perfect for science experiments and science fair!
Preview of Student Questionnaire

Student Questionnaire

Get to know your students... by giving them an opportunity to tell you about themselves. This is an extensive list of 50 questions covering a variety of topics. It can be used in class on the first day as you cover administrative duties or assigned for homework. I posted the document on my website and asked students to complete it and submit it electronically. This helps students become familiar with your website as well as getting into the habit of emailing you assignments or questions (if
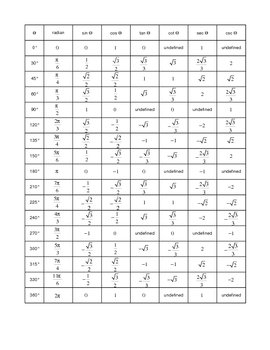
Preview of Reference Sheet Trig Functions

Reference Sheet Trig Functions

Created by
Betty Watson
Completed table for six trig functions and radian measure for all angles between 0 degrees and 360 degrees that are multiples of 30 and 45. Betty Watson Completed Trig Functions Chart by Betty Watson is licensed under a Creative Commons Attribution-Noncommercial 3.0 United States License.
Preview of Algebra 1 Lesson Plan LA Student Standard
Algebra 1 Lesson Plan LA Student Standard

Created by
Kenya Martin
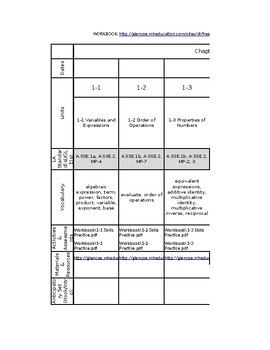
Complete Algebra 1 lesson plan based on Glencoe McGraw-Hill textbook. Includes daily links to assist material and practice problems.
Preview of Budget Sheet Assignment

Budget Sheet Assignment

Created by
Zach Graves
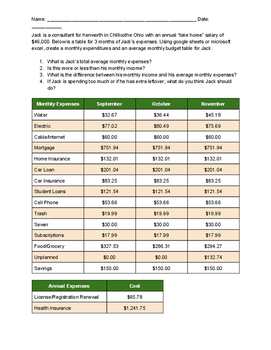
This sheet is a mock example of a person's expenses over the course of three months. It asks students to use technology like excel or google sheets to create tables of expenses. Then compare those tables with an average monthly spending budget sheet. This is mainly to be used to have students practice entering data into the spreadsheet and use the "sum" and "average" equations in the spreadsheet. Afterwards, the students can compare the expenses with the income to see if the budget is over or un
Preview of Classroom Economy Checks System

Classroom Economy Checks System

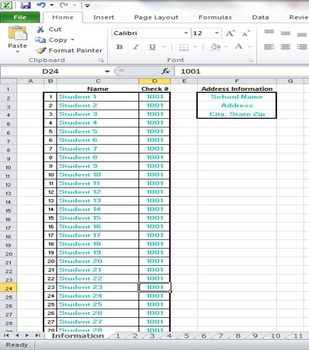
Included in the file are student checks, teacher checks, and a checkbook register. The teacher checks do no have a check number to allow multiple copies and for teachers to pre-write checks as needed. Student checks have check numbers and the ability to have their information to avoid students making multiple copies and misusing the checks system. The first sheet in Excel has a place for the student roster, which changes on the individual student sheets for checks. **The formatting has bee
Preview of Creating Scatter Plots and Lines of best fit on TI-83/84 Graphing Calculator
Creating Scatter Plots and Lines of best fit on TI-83/84 Graphing Calculator

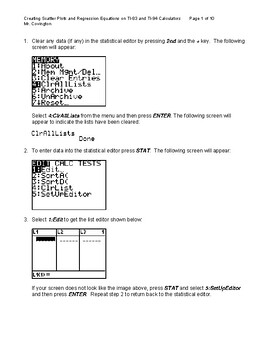
A tutorial and reference guide for working with two-variable data to generate scatter plots and least squares method line of best fit on TI-83/84 graphing calculators and Microsoft Excel.
Preview of Is it normal?  Height Data Activity

Is it normal? Height Data Activity

Created by
Math Luvr
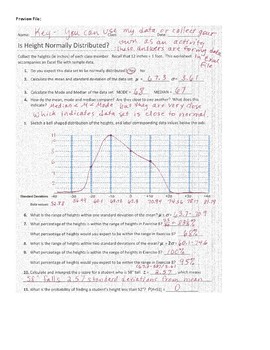
This activity was created to help introduce students to normal data distributions. This file contains an Excel workbook with instructions (for both 2010 and 2013 versions of Excel) for students to do the following: Find the Mean, standard deviation, median, mode, and the distribution of data within a certain number of standard deviations from the mean. Create bar graph and line chart of frequencies. Answer questions regarding data on separate Worksheet. This activity is totally editable, so you
Preview of Graphing with Technology (Microsoft Word/Excel 2013)
Graphing with Technology (Microsoft Word/Excel 2013)

Created by
Jared Laberge
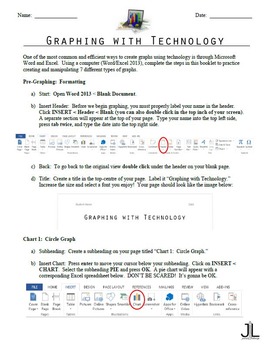
Help students learn to create graphs using technology! This graphing with technology booklet acts as a compressed guide and practice sheet for Microsoft Word/Excel 2013. Each graph contains step-by-step directions and screen-capture images so that students will never get lost. In addition, the data used in this assignment is both relatable and engaging for teenage target groups. By completing this task, students will be able to create 7 different types of graphs using technology: - pie gra
Preview of Microsoft Excel Vector Solver

Microsoft Excel Vector Solver

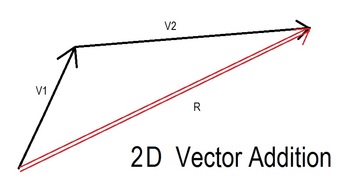
Solve 2 dimensional, non perpendicular vector addition problems on a spreadsheet students create from scratch. Outstanding concept review for adding vectors of all types. Students construct the spreadsheet in a computer lab or at home and then answer questions about how they programmed the spreadsheet and then solve problems using the spreadsheet. The answer key provides full descriptions of any/all necessary spreadsheet manipulations so it is perfect for a teacher needing to brush up on Ex
Preview of Superimposing Wave Functions on a Spreadsheet (Physics)
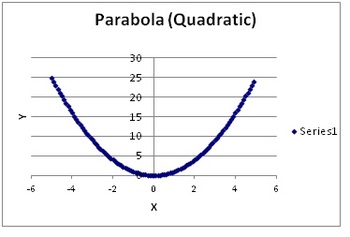
Superimposing Wave Functions on a Spreadsheet (Physics)

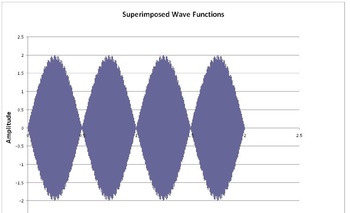
Provided: -Step by step instructions on how to model superposition of waves starting from a blank Excel (2007 or 2003) spreadsheet -Discussion section outlining objectives. -Assessment questions Appropriate for all levels of high school Physics. Applying spreadsheets to study science provides students with skills essential to success in higher education. This activity gives students an interactive experience manipulating variables and observing the resulting wave functions. ******Assessm
Preview of Graphing and Analyzing Functions on a Spreadsheet
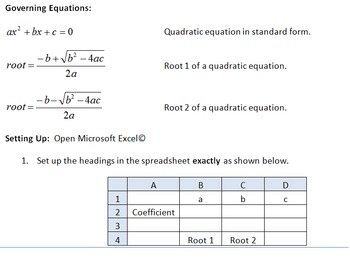
Graphing and Analyzing Functions on a Spreadsheet

This math activity allows students to investigate the behavior of functions (Quadratic, Cubic, Hyperbolic and Exponential) by adjusting the domain over which the functions are viewed. Students are guided with step by step instructions on how to program a blank spreadsheet to graph functions of their choosing over intervals that they specify. Graphs are manipulated and students are guided to look at growth rates of functions and how they behave as they approach larger and smaller values. Real
Preview of The Quadratic Formula and Finding Roots Using Goal Seek on a Spreadsheet
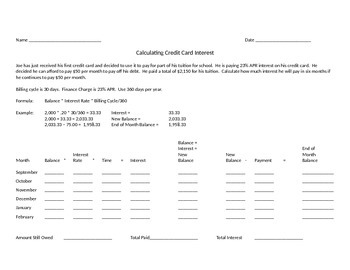
The Quadratic Formula and Finding Roots Using Goal Seek on a Spreadsheet

Students will be guided to produce a spreadsheet from a blank Excel workbook that uses the quadratic formula to find the roots of a quadratic equation. They will then be guided to graph the functions and see the intersection points of the graph with the X axis. Then other nonlinear functions will be solved using Goal Seek. Goal Seek is a trial and error that allows students to solve equations that cannot be solved algebraically. Students will bring all terms of the equation to one side and
Preview of Calculating Credit Card Interest

Calculating Credit Card Interest

Created by
HighSchoolStuff
Students seldom understand how credit card interest in calculated. This activity gives demonstrations and practice into how the calculations are done and how little is generally paid to the principal. This activity would also work with Microsoft Excel or similar spreadsheet software.
Preview of Task Cards for An Introduction to Microsoft Excel 2010
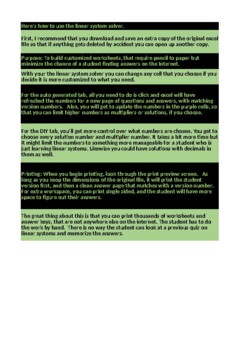
Task Cards for An Introduction to Microsoft Excel 2010

Thank you for choosing Task Cards for An Introduction to Microsoft Excel 2010. This set includes 24 task cards. 12 for Identifying definitions and 12 for labeling. If you see any errors please feel free to inbox me. Please leave comments and rate. Most of all I hope you and your students find this beneficial. Thank you
Preview of Algebra 1 Linear Systems 1000 Worksheets and Keys
Algebra 1 Linear Systems 1000 Worksheets and Keys

Created by
Infinity Testing
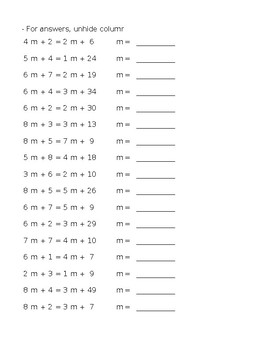
Purpose: To build customized linear systems worksheets, that require pencil to paper but minimize the chance of a student finding answers on the Internet. Features: You can print thousands of worksheets/quizzes that are fresh with unique problems, and even have a version for every student in the classroom. Excel must be installed on your computer already, but this will be user friendly. In fact, you don't have to be familiar with Excel to use this program.
Preview of Quadratic Function Random Generator (Math 20-1, Pre Calculus 11, Foundations 11)
Quadratic Function Random Generator (Math 20-1, Pre Calculus 11, Foundations 11)

Created by
DailyDoseCanada
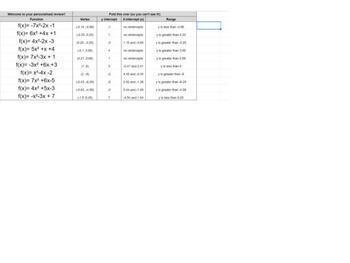
This google sheet randomly generates quadratic functions expressed in standard form and automatically populates the features of the randomly generated quadratic (Vertex, intercepts and range). Simply hit "backspace" on an empty cell and a new list of 20 quadratics will generate. Great for giving students their own personalized review along with the answers check for them to use. You can also copy paste the values into another sheet/document if you're looking to make a larger list of quadratics t
Preview of Algebraic Equation Generator

Algebraic Equation Generator

Give your students a ton of practice solving algebraic equations with this powerful generator. There are four different sheets, which you can use to create various levels of challenge. The first generates equations that only use integers, and only use multiplication and addition; it's perfect for students who are just starting. The next sheet creates equations that still use only integers, but which incorporate subtraction and negative numbers. Finally, there are two sheets which include dec
Showing 1-24 of 53 results

Find Math resources | TPT

Importance of learning math skills

It's no secret that mathematics is one of the foundational subjects that students need to learn. Math forms the basis for so many other subjects — like science, engineering, and technology — and because of that, it's essential that students develop strong math skills starting from a very young age.

Benefits of learning math

Learning math has many benefits. It helps students:

  • Begin to develop problem-solving, logical reasoning, and critical-thinking skills
  • Grow their understanding of numbers and basic operations
  • Understand how math is used in real-life situations

By ensuring that students have a solid foundation, teachers can help set them up for future success.

Discover printable and digital math resources

Math resources are an integral part of effective math education. On TPT, math resources come in various forms: from worksheets and full-year curricula to manipulatives and educational games. They can be used to enhance learning, assess student’s mastery of math concepts, and engage students in meaningful learning. By incorporating math resources from TPT into your teaching toolbox, you can create a rich learning experience that strengthens students’ understanding of math concepts and encourages a positive attitude toward math.

If you’re a teacher or parent looking for printable and digital math worksheets, TPT has an extensive collection of math resources across topics and grade levels. No matter what math topic your students are working on — whether you’re teaching numbers to kindergarteners or algebra to 9th graders — TPT has resources designed to help with any math learning need.

With a little encouragement and plenty of resources, TPT resources can make teaching and learning math so much easier. Plus, you can expand students’ knowledge even further by exploring TPT science resources, which are frequently paired with math lessons.

Frequently asked questions about math resources

What types of math lessons are available on TPT?

There are many different types of math resources sold by Sellers on TPT. Some popular math lessons include geometry, mental math, algebra, fractions, place value, measurement, and decimals.

How do I find math lessons on TPT?

Educators can save time preparing math lessons with resources created by experienced teachers. Simply start a search for math resources on the TPT marketplace, and filter by grade level, price, and/or resource type to find materials that've been proven to work in classrooms like yours. No matter what you’re teaching, there are plenty of math lessons and activities sold by Sellers on TPT that are tailored to meet your students' skill levels.

How do I support students struggling with math?

If your student or child is struggling with a specific math concept, you can provide extra support and resources such as math worksheets. Sometimes, visual aids like charts, graphs, and manipulatives can help children understand abstract concepts better.

How can I make math fun?

Students learn best when they're engaged! Sprinkle a little fun into your math lessons by using educational games, videos, puzzles, and real-life scenarios. If your class seems to find math boring or uninteresting, you can also try connecting lessons to their interests or hobbies. Encourage them to ask questions and explore mathematical concepts in different ways.