13 results
Statistics assessments on sale
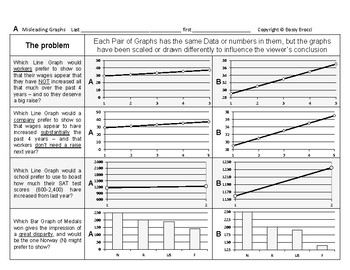
Stats&Data 14: Misleading & Misinterpreting Data Graphs Charts Statistics
This is an excerpt from my popular line ofBossy Brocci Math & Big Science workbooks on Amazon.ANSWER KEY included=======================Students will:1) Analyze 20 different Graphs or Data Displays2) Draw Conclusions & Answer questions about theaccuracy, fairness, limitations & legitimacy of those Graphs3) Answer 16 Multiple-choice questionsbased on their Calculations & Observations4) Be compelled to show their work in a neat & orderly format5) Be trained to methodically &
Subjects:
Grades:
Not Grade Specific
Types:
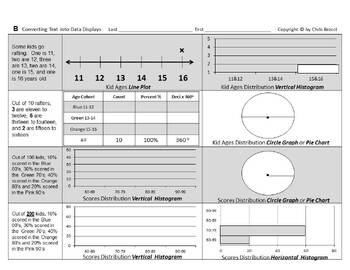
Stats&Data Bundle C: Data Displays Measures of Central Tendency & Variation
From the Author of Bossy BrocciMath & Big Science workbooks on Amazon,this Bundle of Data Displays,Measures of Central Tendency(Mean, Median, Mode & Range);and Measures of Variation(Quartiles, Interquartile Range, Outliers & Box Whisker plots)contains:11 Lessons32 Worksheets832 Problems & Tasks- and Assessment up the a$$=======================Answer KEYS included=======================Coverage Specifics:#1 Identify & Select Common Typesof Data DisplaysStudents will:1) Identi
Subjects:
Grades:
Not Grade Specific
Types:
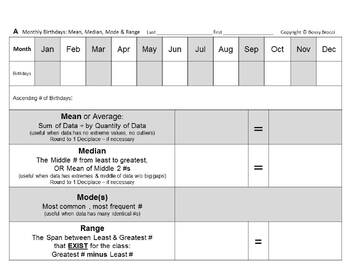
Stats&Data Bundle B: Birthdays Data Displays Variation Mean Median Mode Range
From the Author of Bossy BrocciMath & Big Science workbooks on Amazon,this Birthdays Stats (Mean, Median, Mode, Range),Measures of Variation & Data Displays Bundlecontains:2 Lessons12 Worksheets294 Problems & Tasks- and Assessment up the a$$=======================Answer KEY included=======================Coverage Specifics:#1 Author's Numbers Birthdays ProjectStudents will:1) Convert the given Monthly Birthdaysfrom Mr. Brocci's School numbers into:Ascending List/Data SetMeanMedianMod
Subjects:
Grades:
Not Grade Specific
Types:
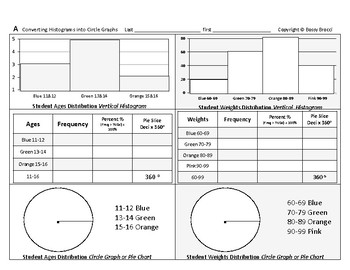
Stats&Data 03: Convert Histograms into Circle Graphs Construct Create Pie Charts
This is an excerpt from my popular line ofBossy Brocci Math & Big Science workbooks on Amazon.Answer KEY included=======================Students will:1) Convert 3 Vertical Histograms into3 Data Tablesand3 Colored or Shaded Circle Graphs (Pie Charts)2) Convert 1 Horizontal Histogram into1 Data Tableand1 Colored or Shaded Circle Graph (Pie Chart)3) Be compelled to show their work in a neat & orderly format4) Be trained to methodically & systematicallyPresent Data in different DisplaysN
Subjects:
Grades:
Not Grade Specific
Types:
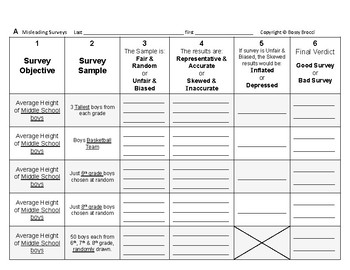
Stats&Data 13: Misleading & Misinterpreting Surveys & Statistics + QUIZ
This is an excerpt from my popular line ofBossy Brocci Math & Big Science workbooks on Amazon.ANSWER KEY included=======================Students will:1) Read 10 different Surveys and Survey Samples2) Determine and Write if those Surveys are:Fair & RandomUnfair & BiasedRepresentative & AccurateSkewed & InaccurateInflatedDepressedGood SurveyBad Survey3) Answer 24 Multiple-choice questionsbased on their Observations4) Analyze 5 Statistical Problems & Conclusions for accuracy
Subjects:
Grades:
Not Grade Specific
Types:
COMPLETE CRASH COURSE Statistics Series Video Quiz Google Forms Bundle
These are GOOGLE FORMS quizzes and printable PDF worksheets for 44 CRASH COURSE STATISTICS SERIES VIDEOS. Each product includes:2 Differentiated Versions of the QuizEasy Version (With a Word Bank)Harder Version (Without a Word Bank)These quizzes can be used as a video guide to hold students accountable as they watch the video. It can also be used as a video quiz to assess student learning or as part of homework. These quizzes can be assigned to your GOOGLE CLASSROOM for DISTANCE LEARNING.The GO
Subjects:
Grades:
9th - 12th, Higher Education, Adult Education
Types:
Statistics and Probability Exam Bank - Test and Quiz Questions Editable
Probability and statistics are used to explain, organize, gather, and evaluate numerical data as well as to comprehend chance. It is very useful specially from election results to product surveys, from weather reports to complex genetics research, probability and statistical language are becoming necessary for students to evaluate the validity of an argument that is backed up by evidence that seems convincing.These 100 multiple choice questions test bank is complete and can help your students t
Subjects:
Grades:
9th - 12th, Higher Education
Types:
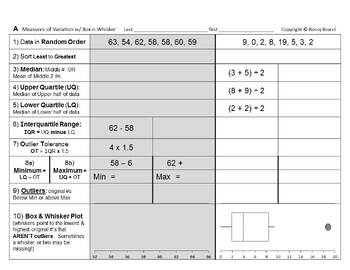
Stats&Data Bundle A: Box Whisker Box Plots & Measures of Variation bundle
Spun-off from my popular series of Bossy Brocci Math & Big Science Workbooks on Amazon,this Measures of Variation Box & WhiskerBox Plots Bundlecontains:4 Lessons10 Worksheets263 Problems & Tasks- and Assessment up the a$$=======================Answer KEYS included=======================Coverage Specifics:#1 From Quartiles Interquartile Range& Outliers to Box Whisker PlotsStudents will:1) Sort or Sequence 8 different Data Sets or Sets of Numbers2) Calculate & Identify for each
Subjects:
Grades:
Not Grade Specific
Types:
Data Strand Assessment Package - Grade 6
Grade 6 Math Assessments - D. Data StrandUpdated Curriculum Assessments Included:D1.1Describe the difference between discrete and continuous data, and provide examples of each.D1.3Select from among a variety of graphs the type of graph best suited to represent various sets of data; display the data in the graphs with proper sources, titles, and labels, and appropriate scales.D1.5determine the range as a measure of spread and the measures of central tendency for various data sets, and use this in
Subjects:
Grades:
6th
Types:
Also included in: Grade 6 Math Assessment Bundle- Full Year
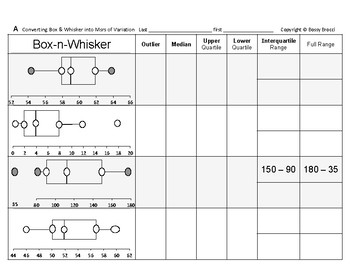
Stats&Data 07: Convert Box Whisker Plots Quartiles Interquartile Range Outliers
This is an excerpt from my popular line ofBossy Brocci Math & Big Science workbooks on Amazon.Answer KEY included=======================Students will:1) Analyze 8 Box & Whisker Plots (Box Plots)2) Identify:OutlierMedianUpper QuartileLower QuartileInterquartile RangeandFull Rangefrom each Box & Whisker Plot3) Be compelled to show their work in a neat & orderly format4) Be trained to methodically & systematically Analyzeand Convert Box & Whisker Plots into Measures of Varia
Subjects:
Grades:
Not Grade Specific
Types:
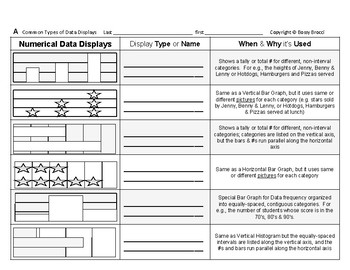
Stats&Data 01: Identify & Select Common Types of Data Displays
This is an excerpt from my popular line ofBossy Brocci Math & Big Science workbooks on Amazon.Answer KEY included=======================Students will:1) Identify and Label various Data Displays, including: Vertical Bar GraphVertical PictographHorizontal Bar GraphHorizontal PictographVertical HistogramHorizontal HistogramLine Plot (X Plot)Stem and Leaf PlotCircle Graph or Pie ChartandLine Graph2) Read about and Learn the appropriate usagefor each of those Data Displays3) Be compelled to show
Subjects:
Grades:
Not Grade Specific
Types:
Probability Experiments- Experimental and Theoretical Probability Games Activity
Probability Experiments, teachers can engage their students in an exciting exploration of theoretical and experimental probability. This comprehensive package includes a detailed lesson plan that covers the fundamental concepts and aligns with Common Core State Standards. But that's not all! The highlight of this probability activity is the captivating student performance task, where students become probability scientists and design their own experiments using everyday items like coins, spinners
Subjects:
Grades:
10th - 12th
Types:
CCSS:
8th Grade Math - Probability (ID Independent & Dependent Events) Google Form #1
Hello! The purchase of this product grants the purchase of one (1) DIGITAL (Google Forms) Assessment with twenty (20) problems on identifying independent & dependent events.Goals of this Digital Assessment: For students to use as a tool to study & practice:Identifying independent & dependent events.Technical Details About The Google Forms Assessment:ALL digital assessments provided are completely editable. (NOTE: If answers in the Google Form you purchase are digital, you MUST HAVE E
Subjects:
Grades:
7th - 8th
Types:
Showing 1-13 of 13 results


