Reading a Bar Graph and Using it Compare Information
EducPrek12
230 Followers
Description
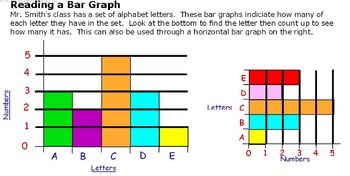
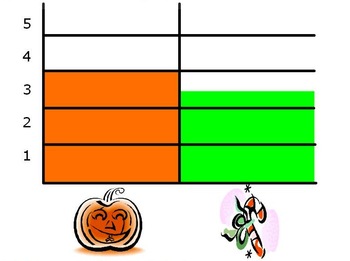
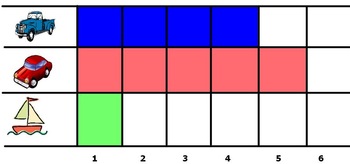
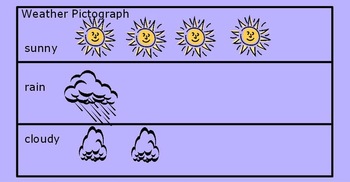
This 10 slide Math Activ Studio flipchart teaches students to read a bar graph and use it to compare information. This lesson is aligned with the Houghton Mifflin Math Series, 4.4 - 1st grade, although it can be used to teach concepts in grades K-4. This lesson begins with the “Problem of the Day” in which students are given a weather pictograph and a corresponding word problem in which they solve by reading the pictograph and comparing information. Next, the flipchart displays the daily objective, then reviews vocabulary term(s) needed to understand the content of the lesson: pictograph, tally chart, and bar graph. Next, the students are shown a vertical and horizontal bar graph to show how information is displayed through bar graphs, along with a description and explanation of the bar graphs (Mrs. Smith’s class set of alphabet letters). Next, there is a video embedded into the flipchart for the students to watch on making pictographs (if your software support the viewing of the video). Next the students will read a horizontal color-coded bar graph and interpret how many people drove trucks, drove cars, and took boats to an event (you can slide the bars in the chart up and down to change the data on this page). The teacher will then ask students questions about the bar graph (notes included in flipchart). The next slide presents a vertical bar graph to students about different types of cookies - the students will then manipulate the color bars on the Promethean Board to give the correct information about the cookies and answer questions about the bar graph (notes included). Next, 5 students are surveyed on their favorite holiday: Christmas or Halloween, and another student may raise the colored bars to show the information on the Promethean Board. The students are then given a list of guided and individual work to complete (aligned with the textbook directions). The next page gives a review and closure question to check for students’ understanding of the lesson taught in which they are asked with a corresponding information from the text - “what would happen if one more sailboat appears, how would the graph change?” (if you are not using the text, then use a graph from the lesson and add one more, and ask the students how it would change). The last page gives a math journal entry in which students are to create their own bar graph using colors to demonstrate bars (page provides two examples).
Total Pages
10 pages
Answer Key
N/A
Teaching Duration
50 minutes
Report this resource to TPT
Reported resources will be reviewed by our team. Report this resource to let us know if this resource violates TPT’s content guidelines.


