268 results
Common Core HSS-ID.A.3 resources under $5

Scatter Plot Project with Real World Sports Data
Practice creating and analyzing scatter plots with these six differentiated real world projects. Students are provided statistics for a sport and must graph the data. Then, they write an analysis describing correlation, whether or not the data is linear, any outliers, and how the scatter plot might be used to make predictions. The scatterplots range from 38 points to 149 points, so they can be used to differentiate. The scatter plots will take a little time to plot, but they result in real
Subjects:
Grades:
8th - 9th
Types:
CCSS:
Also included in: 8th Grade Math Activities & Lessons Bundle for the Whole Year

Dot Plots and Histograms Google Forms Homework
This 20-question, auto-grading Google Forms assignment provides students with practice constructing and analyzing data displayed in a dot plot or a histogram.Please note:Questions include a variety of types: "multiple-choice", "short response", "drop down", "select all that apply".Background knowledge includes mean, median, mode, range, and calculating percentages.This download also includes a PDF "worksheet" with the exact same questions as the Google Form. Just assign digitally or print + go!T
Grades:
6th - 9th
Types:
CCSS:
Also included in: Algebra 1 Google Forms Semester 2 Digital and Printable Homework Bundle
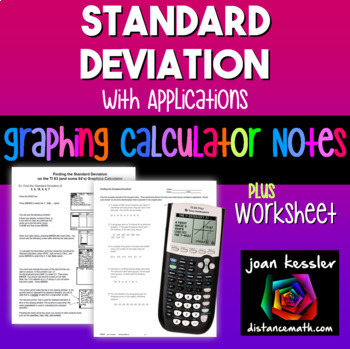
Standard Deviation on TI-84 Reference Sheets plus Practice
With this Determining the Standard Deviation on the TI 83 TI 84 Graphing Calculator plus HW step by step reference sheet your students will learn to use the graphing calculator effectively in finding the standard deviation from a data set. Use as Binder Notes or printed smaller for Interactive Notebooks.What's included?Two reference/handouts for students to learn how to find the Standard Deviation for both a population and for sample. One is for the TI 83 (yes, still in use) and the other for th
Subjects:
Grades:
8th - 11th
CCSS:
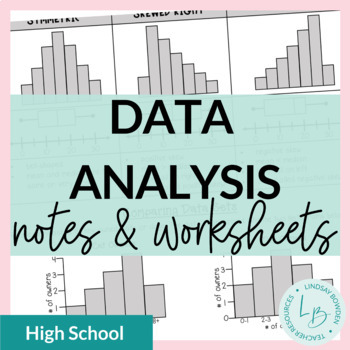
Data Analysis: Shape, Center, and Spread Notes and Worksheets
These data analysis notes and worksheets compare two data sets with regards to shape, center, and spread of data.They cover:comparing data of two sets using histograms, dot plots, box and whisker plots,and stem and leaf plotsshape (symmetrical, skewed right, skewed left)center (mean, median)peaks (mode)spread analyzing what these factors mean in context of the problem4 pages + all answer keysYou may also like:Mean, Median, and Mode Notes & WorksheetsBox and Whisker Plots Notes & Workshee
Subjects:
Grades:
8th - 10th
CCSS:
Also included in: Statistics Unit Bundle
Statistics Project - Statistics Olympics
Engage your students in their study of statistics as they compete in self-created Olympic style events. This project will engage students and help them discover meaning and apply concepts including measures of central tendency, quartiles, outliers, variance, standard deviation, z-scores, box plots, histograms, normal and skewed distributions. This project can be completed in approximately 6-8 days (50-min class periods) ** March 2023 Update **Visual updates to all slides and documentsRubric ali
Subjects:
Grades:
6th - 12th
CCSS:
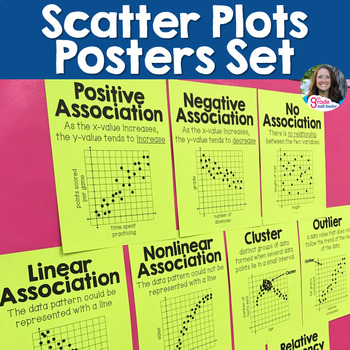
Scatter Plots and Two Way Tables Posters Set for 8th Grade Math Word Wall
Make the vocabulary visible and accessible for your students! This set of 12 printable vocabulary posters provides visuals and reminders for your students to reference during your Bivariate Data unit. Display these on your word wall while teaching scatter plots and two-way tables!The following vocabulary terms are included:scatter plotpositive association or positive correlationnegative association or negative correlationno association or no correlationlinear associationnonlinear associationoutl
Subjects:
Grades:
8th - 9th
Types:
CCSS:
Also included in: 8th Grade Math Vocabulary Posters for Word Wall - Full Year
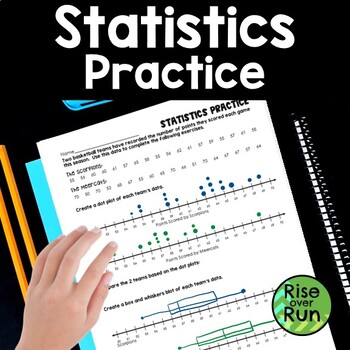
Box and Whiskers and Dot Plot Practice
Practice creating dot plots and box & whiskers plots with this statistics activity.Students are given scores for 2 basketball teams. They use the data to create a dot plot (or line plot) for each team and then a box and whiskers diagram for each team.Then, they compare the data of the teams.A bonus question asks students to calculate the mean absolute deviation.This worksheet can lead to great discussions about how to analyze box and whisker diagrams and make comparisons!
Subjects:
Grades:
6th - 7th
Types:
CCSS:
Also included in: Algebra 1 and 8th Grade Math Curriculum Bundle for Entire Year
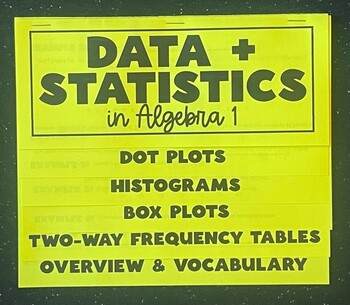
Data and Statistics in Algebra 1 Foldable Notes - Fully Editable
This editable algebra 1 foldable provides an introduction and overview for most of the univariate and bivariate data and statistics taught in the Algebra 1 standards. It is organized by the following tabs:Dot PlotsHistogramsBox PlotsTwo-Way Frequency TablesOverviewWithin the foldable there are at least two examples for each type of graph. It also allows for you to review/ address the following terms: mean, median mode, range, interquartile range, outliers, standard deviation, marginal and joi
Grades:
8th - 10th
CCSS:
Also included in: Data Analysis and Statistics Foldable Bundle

High School Data Analysis Project
This project covers a large range of data analysis methods. There are eleven total parts to the project.
Part One: the students have to collect data from 20 students outside of the classroom. Directions specify to ask students from each grade level.
Part Two: Measures of Center and Variation. Students will calculate mean, median, mode, range, and standard deviation for some of the data collected. Definitions of each term are included.
Part Three: Box-And-Whisker Plot. Students will create t
Subjects:
Grades:
9th - 12th
Types:
CCSS:
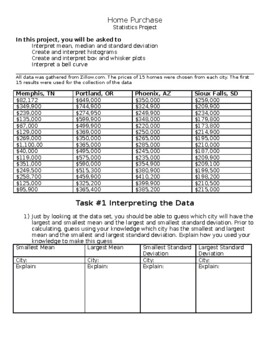
Home Prices: High School Statistics Project
This statistics project has students exploring home prices and using their knowledge of mean, median, standard deviation, histograms, box and whisker plots, and bell curves to make predictions and inferences about the data. This project is provided in a word document to allow the teacher the ability to edit the document or load it to a google doc. In this project students first make predictions about measures of spread and central tendency without calculating but by looking at the data. Students
Subjects:
Grades:
9th - 12th
Types:
CCSS:

Dot Plots, Histograms, and Box Plots Quiz for Google Forms™ - 6.SP.4
About This Resource:This is a Google Forms Quiz on creating and interpreting dot plots, histograms, and box plots. The instructions are easy to follow for you to make a copy of the quiz to your Google Drive. Then you can assign to your students using Google Classroom or some other method.Questions on this assessment were carefully created to give our students the best practice on the following standard.6.SP.4 - Display numerical data in plots on a number line, including dot plots, histograms, an
Subjects:
Grades:
6th - 10th
Types:
CCSS:
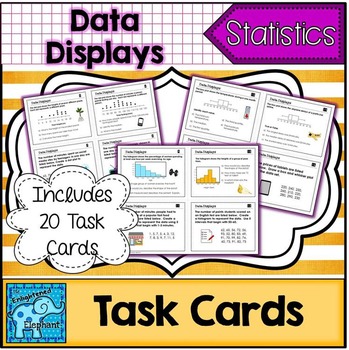
Data Display Task Cards
There are 20 total task cards, a student recording sheet and answer key. These tasks meet HSS.ID.A.1, HSS.ID.A.3, HSS.ID.B.6
There are 4 questions for each of the following types of data displays:
dot plots
stem and leaf plots
histograms
box plots
scatter plots
Students will be asked to read and interpret each type of data display as well as create each type of data display from a contextual set of data.
Use task cards at centers or stations, for entrance and exit tasks and for activities lik
Subjects:
Grades:
7th - 10th
Types:
CCSS:
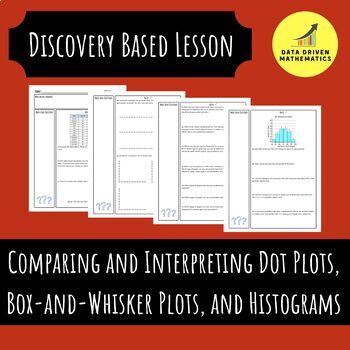
Comparing and Interpreting Dot Plots, Box-and-Whisker Plots, and Histograms
About This Resource:A four page packet containing an investigation into comparing and interpreting dot plots, box-and-whisker plots, and histograms. In addition, you will receive the answer key to help with the implementation of this activity in your classroom. The worksheet flows perfectly and could be used in more of a discovery format or a instructor guided notes.What's Included:You will receive a zipped folder. Inside the zipped folder is a worksheet and the answer key in PDF format.Similar
Subjects:
Grades:
6th - 10th
CCSS:
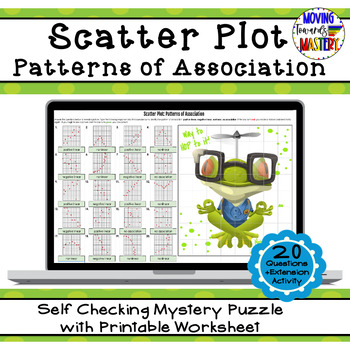
Scatter Plot: Patterns of Association Self Checking Mystery Picture
Engaging math self checking review activity to practice identifying patterns of association for scatter plots.This self-checking activity will allow students to practice identifying patterns of association for scatter plots. Students will use their understanding of scatter plots to answer questions to reveal pieces of a mystery puzzle as they work, just like a pixel art activity! If students answer incorrectly, the box will turn red and NO picture pieces will be revealed. This resource include
Subjects:
Grades:
7th - 10th
Types:
CCSS:
Also included in: 8th Grade Math Common Core Growing Bundle
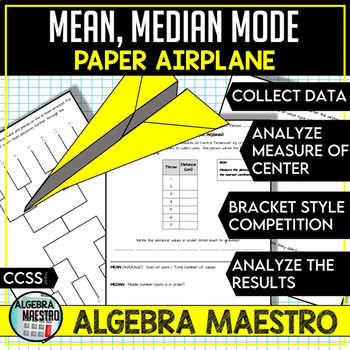
Measure of Center: Paper Airplane Activity
Students can further explore the meaning of statistical measures of center: mean, median, and mode by experimentation. This is a fun activity to explore measures of center. I use this activity with my Algebra 1 students when we start our descriptive data unit before we start talking about graphical displays (i.e. box plots, histograms, etc.). We compare measures of centers and analyze when it is appropriate to use a specific measure.Included:1. Collect data from Paper Airplane 2. Bracket t
Subjects:
Grades:
5th - 11th
Types:
CCSS:

Measures of Central Tendency Google Forms Homework
This 8-question (26- part), auto-grading Google Forms assignment provides students with practice calculating and analyzing measures of central tendency. Questions are organized in the following way:#1-5: Calculate/ Find the mean, median, mode, and range.#6-7: Solve for a missing data value, when the mean is given.#8: Interpret the "best" measure of center (mean or median) and justify your answer.Most questions are "short-response" with a few "select all that apply".This download also includes a
Grades:
6th - 9th
Types:
CCSS:
Also included in: Algebra 1 Google Forms Semester 2 Digital and Printable Homework Bundle
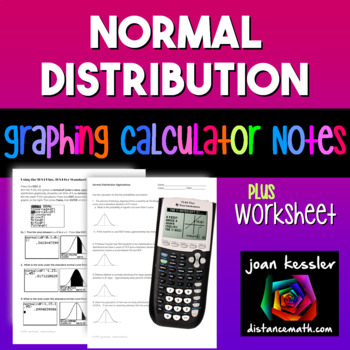
Normal Distribution | TI-84 Calculator Reference Sheet and Practice
With this Normal Distribution concise, step by step handout, your students will learn how to use the TI 83 and TI 84 Graphing Calculators to find probabilities for the Standard Normal Distribution and also find probabilities for Applications to the Standard Normal Distribution. They will also learn how to use the shade feature to construct a graph and have the calculator shade in the appropriate region.These can be used as Binder Notes or printed smaller for Interactive Notebooks.Note: This han
Subjects:
Grades:
9th - 12th
Types:
CCSS:
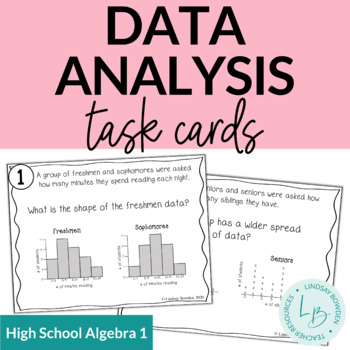
Data Analysis: Spread, Center, and Shape Task Cards
The digital version of this resource for Google Drive™ using Google Forms can be found here: Distance Learning: Data Analysis Digital Task Cards. You are able to edit this assignment using Google Forms and assign it to your students via Google Classroom.These data analysis task cards includes:comparing data of two sets using histograms, dot plots, and box and whisker plotsshape (symmetrical, skewed right, skewed left)center (mean, median)peaks (mode)spread (from looking at the graph)12 task card
Subjects:
Grades:
8th - 10th
Types:
CCSS:
Also included in: Statistics Unit Bundle
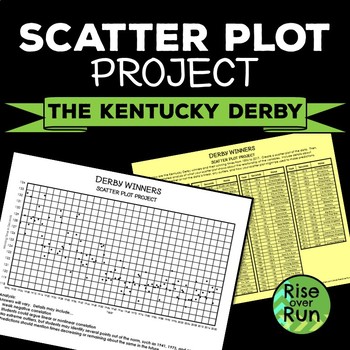
Scatterplot Project with Real World Stats from the Kentucky Derby
Practice creating and analyzing scatter plots with this project. Students are provided statistics for winning horses and must graph the data. Then, they write an analysis describing correlation, whether or not the data is linear, any outliers, and how the scatter plot might be used to make predictions. This is one of the projects in my Differentiated Scatter Plot Projects!Thank you for your interest in this resource from Rise over Run. Related Resources:Scatter Plot Practice WorksheetsScatter
Grades:
8th - 9th
Types:
CCSS:
Also included in: Algebra I Sub Plans Bundle with Activities

Statistics Survey Project - Project Based Learning (PBL) with Math
Watch your students dive into the world of math as they create, execute, and analyze their own survey! Students will demonstrate mastery of data gathering, survey sampling, developing appropriate survey questions, data tables, Direct Variation, discrete graphs, dot plots, box and whisker graphs, and calculating the inter-quartile range.The Unique Survey Project is highly engaging, capitalizing on the innate curiosity of the adolescent mind. You will love the low-prep instructional guide. Your st
Subjects:
Grades:
6th - 10th
Types:
Also included in: Fun with Ratios Activities Bundle - 7th Grade PBL with Math
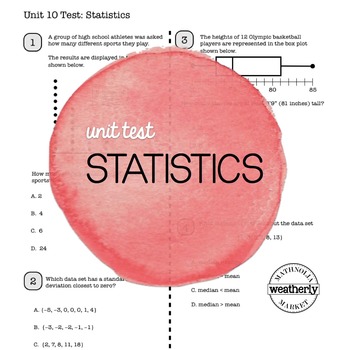
STATISTICS Unit Test CC Algebra 1
The Algebra I Common Core Unit Test will assess your students’ understanding of STATISTICS
Included topics:
Graphical Displays
Quartiles
Box Plots
Measures of Central Tendency
Variation
Two Way Frequency Tables
BiVariate Data
Linear Regression
Quantifying Predictability
Residuals
This assessment can serve as a test at the end of the unit, as a diagnostic tool prior to teaching the topics or as a “test prep” activity prior to state testing.
CCSS addressed:
N-Q.1
S-ID.1
S-ID.2
S-ID.3
S-ID.5
Subjects:
Grades:
9th - 12th
Types:
CCSS:
Also included in: Algebra 1 assessments - UNIT TEST BUNDLE
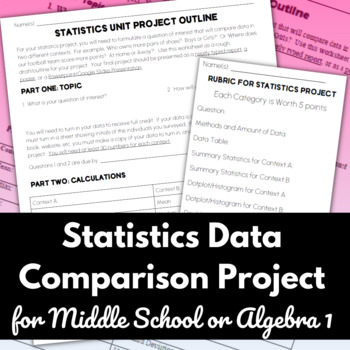
Statistics Data Comparison Project -Data Collection, Summary Statistics & Graphs
Engaging, easy prep statistics data collection project! Students develop a research question comparing data from two different contexts, collect data, then use summary statistics, measures of central tendency, and graphs to find the answer to their question. Perfect way to incorporate project-based learning into your statistics unit for middle school or algebra.Students choose a question of interest where they will compare two sets of data using summary statistics (mean, median, etc.) and graph
Subjects:
Grades:
7th - 9th
Types:
CCSS:
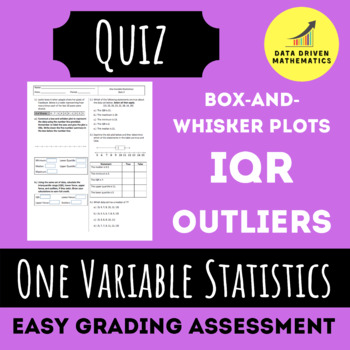
One Variable Statistics Quiz 2 (Box-and-Whisker Plots, IQR, and Outliers)
About This Resource:With this purchase you will receive the second quiz of my One Variable Statistics Unit. This quiz covers box-and-whisker plots, the interquartile range, and identifying outliers. Your purchase will also include the answer key.The questions are meant to prep our students for the Smarter Balanced Assessment (SBAC testing) with a variety of different question formats you might find on the state assessment.What's Included:You will receive a zipped folder. Inside the zipped folder
Subjects:
Grades:
6th - 10th
Types:
CCSS:
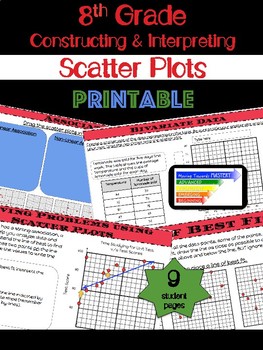
8th Grade Math Constructing & Interpreting Scatter Plots
Extensive printable lessons for constructing and interpreting scatter plots.The lessons are scaffolded to build understanding. Students will progress from identification of terms to making predictions involving bivariate data. The guided lessons will begin with identification, move towards assisted analysis, and conclude with independent practice.Lessons include...♦ Definitions and Visual Representations♦ Identification and Use of Terms → Bivariate Data → Scatter Plot → Linear, Nonli
Subjects:
Grades:
8th - 10th
Types:
CCSS:
Also included in: 8th Grade Math Common Core Growing Bundle
Showing 1-24 of 268 results

