43 results
Free Common Core HSS-ID.A.3 resources
FREE EDUCATIONAL WEBSITES LIST 4 ALL GRADES K-12 AND SUBJECTS + TEACHER RESOURCE
Sometimes, you just need a list of websites for everyone. Here it is. FREE EDUCATIONAL WEBSITES Put together by Teach Me, Maria!It takes time to gather this information, figure out the appropriate grade levels, and format, maintain, and update this page. All I ask is for an honest review if this list helps you.
Subjects:
Grades:
PreK - 12th, Staff
Types:
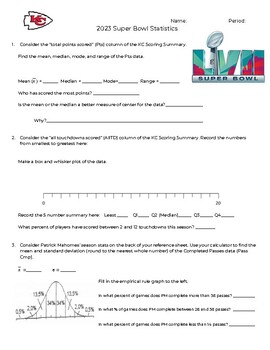
2023 Super Bowl Statistics Activity
This activity contains two stats sheets - one for the Philadelphia Eagles and one for the Kansas City Chiefs. Students are asked to use the data from the various tables to answer questions about the teams. This activity covers 1 variable statistics (mean, median, mode, range, standard deviation, box-and-whisker plot, histogram, two-way tables).This would be great as a partner activity or class activity.
Subjects:
Grades:
7th - 12th
Types:
CCSS:
Statistics: Plots, Shapes of Distributions, Choosing Mean or Median
Statistics Integrated Review: Plots, Shapes of Distributions, and Statistics for Center and SpreadUse common data plots to determine shape of the data distribution, and choose appropriate statistics for center and spread. This product includes a one-page integrated review with a worksheet and answer key aligned with the common core. Students practice identifying the shape of a data distribution using common data plots (dot plot, histogram, and boxplot). Students also review how to choose appropr
Subjects:
Grades:
8th - 12th
Types:
CCSS:
Also included in: Bundle: Algebra 1 Statistics Unit Curriculum (Common Core)
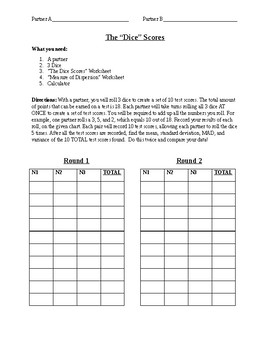
Dice Activity for Standard Deviation
This is a great activity that helps the students understand standard deviation! With a partner, the students will roll 3 dice to create a set of 10 test scores. The total amount of points that can be earned on a test is 18. Each partner will take turns rolling all 3 dice AT ONCE to create a set of test scores. They must add up all the numbers they roll. For example, one partner rolls a 3, 5, and 2, which equals 10 out of 18. Record your results of each roll, on the given chart. Each pair will r
Subjects:
Grades:
7th - 12th
Types:
CCSS:
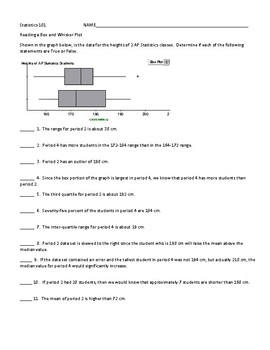
Box and Whisker Plots--11 True False Questions
Compare side by side box and whisker plots by answering 11 True/False questions.
Subjects:
Grades:
9th - 12th, Higher Education
Types:
CCSS:
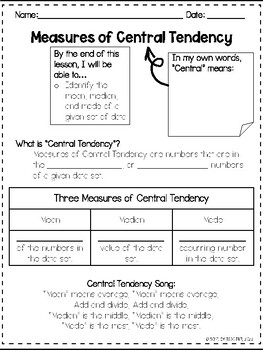
Statistics: Measures of Central Tendency Notes & Practice
Students will be learning how to solve for the mean, median, mode and range of a given data set through guided notes. There is a practice at the end for them to work on independently.
Subjects:
Grades:
6th - 9th
Types:
CCSS:
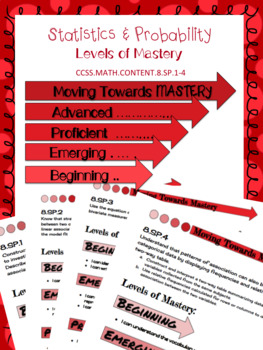
8.SP Scatter Plot & Two-Way Table Levels of Mastery
This product was created to use as an introduction to teaching the eighth grade statistics and probability standards. It allows students to evaluate themselves throughout the process of teaching the standards. It can be printed and provided to each student or printed as posters to be hung in the classroom for easy reference.
Levels of mastery are:
→ Beginning
→ Emerging
→ Proficient
→ Advanced
Levels of Mastery Posters:
★ 8.SP.1 Constructing & Interpreting Scatter Plots
★ 8.SP.2 Line of
Subjects:
Grades:
8th, Higher Education
Types:
CCSS:
Also included in: 8th Grade Math Common Core Growing Bundle
Common Core Algebra I - Unit #10.Statistics
Standard statistical displays of data are reviewed at the beginning of the 10 lesson unit. Box plots are used to compare data sets and emphasize use of the quartiles and interquartile range. Measures of central tendency and dispersion, such as mean and standard deviation, are discussed and interpreted in real world scenarios. Two way frequency charts are used to compare data and bivariate data analyses allow the fitting of data with linear and exponential functions.To access the lesson videos on
Subjects:
Grades:
8th - 10th
CCSS:
10 Free Big Brain Math Problems
This is a sample of the 100 and 180 Big Brain Math Problem I have created with a couple of my students. I write these problems on the window of my classroom everyday and get about 5-10 students a day coming to try to solve them. It's been an enjoyable experience to have students come try the problem of the day and share their solutions with me. Please consider purchasing the 100 or 180 Big Brain Math Problems. There's enough for one a day for the entire school year and range from 1-5 Star diffic
Subjects:
Grades:
9th - 12th
Types:
CCSS:
Central Tendency Notes - Mean, Median, Mode, Range, and Outlier
These notes on central tendency (mean, median, mode, range, and outlier) are a great way to introduce the analysis of number sets! I have included examples for you to teach, or you can simply print out these notes for your students to have.
Subjects:
Grades:
6th - 9th
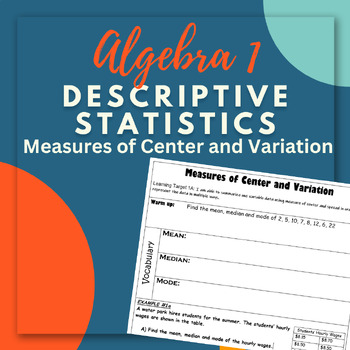
Measure of Center and Variation Notes Outline
This is an editable copy of a notes outline for Algebra 1. This outline is designed to be used within the Descriptive Statistics Unit. These notes cover measure of center and variation. Check out my other notes outlines and my student reflection tools that align with the notes for each unit!
Grades:
9th - 12th
CCSS:
Also included in: Descriptive Statistics Notes and Student Reflection Bundle
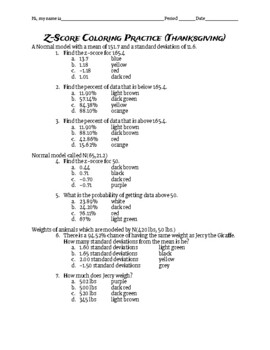
Z-Score Coloring Activity (Thanksgiving)
Great Extra practice calculating and applying z-score to a normal distribution problem. Print this out as a packet or use your desired technology to let students draw on the pdf!
Subjects:
Grades:
10th - 12th
Types:
CCSS:

Oh So Sweet Statistics - A Histogram Project
Give students the unique opportunity to not only create their own statistics, but reflect on their own progress too! We started with an estimation station each week, where I filled a new size jar with a different candy across three weeks. The student who had the lowest absolute deviation from the actual amount of candy in the jar - WON THE WHOLE JAR! After three weeks, we had more than enough candy and data to peak their interest. Students now get to use the results to engage with one variable s
Subjects:
Grades:
8th - 10th
Types:
CCSS:

The Guardian Frogs of Borneo: Interdisciplinary Science Mini-Unit
This FREE, interdisciplinary mini-unit is all about why exceptions matter in biology and in everyday life. The Gist: Out of 8,000+ frog species, Guardian Frogs are one of the first to show females that call & males that care for offspring. Students will gain wonder and appreciation for how diverse animal mating systems are while doing fun activities and analyzing real data.Driving Questions:Across animal species, is there truth to the stereotype that males are “competitive,” while females ar
Grades:
5th - 9th
CCSS:
NGSS:
MS-LS1-4
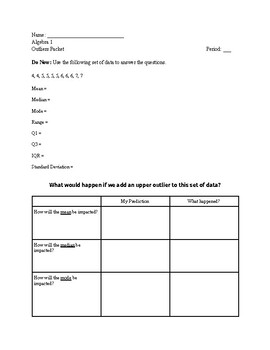
Effect of Outliers Activity
This download contains an activity that allows students to discover the effect outliers have on a set of data. Students begin by calculating the statistics of a set of data. They predict what will happen when an outlier is added. Then, they re-calculate the statistics and draw conclusions.
Grades:
9th
CCSS:
FREE Stat Libs Digital Statistics Vocabulary Activity
Distance Learning: FREE Stat Libs Interactive Statistics Vocabulary Activity (Common Core Aligned) This Stat Libs is a free drag-and-drop interactive activity designed with distance education in mind. Students drag and drop statistics vocabulary terms in a “Mad Libs” type activity to complete a paragraph. This activity is aligned with Common Core Standards that are typically taught in Algebra I and helps students to practice statistics terminology. Stat Libs are an easy, fun way to help students
Subjects:
Grades:
8th - 12th
Types:
CCSS:
Also included in: Bundle: Algebra I Statistics Activities (Common Core Aligned)
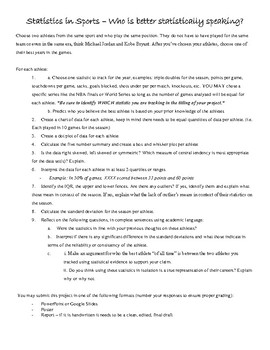
Statistics in Sports - Who is better statistically speaking?
Give students the unique opportunity to explore athletes from any sport, peak their interest, and engage with one variable statistics in a meaningful way. Just create a quick rubric based on your grading practices and let them SOAR!
Suggested to have students claim their athletes or sports events in advance to avoid too many duplicates, especially if students will be presenting their findings.
Subjects:
Grades:
8th - 10th
CCSS:

Which One Does Not Belong? Scatterplots
Which One Does Not Belong (or WODB) activities are quick and easy to use as warm ups, discussion starters, and lesson openers or closers. The beauty of WODB is that there is no one right answer or wrong answer. WODB spark discussions that can help deepen conceptual learning. Project the slide on a screen for whole class discussion or small groups. Upload the activity to student learning platforms such as Google Classroom and use it in the discussion board feature. Encourage students to use math
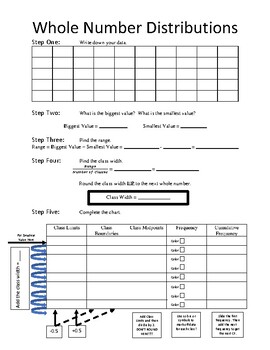
Frequency Distributions Guided Directions
These guided directions help students to create a whole number frequency distribution chart. The information can help students organizing data and putting data into histograms, frequency polygons, and ogives (cumulative frequency graphs).
Subjects:
Grades:
9th - 12th, Higher Education
Types:
CCSS:
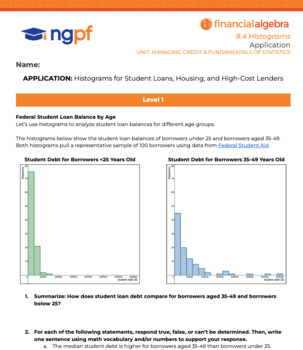
Histograms for Student Loans, Housing, and High-Cost Lenders
What's more draining to think about -- student loan debt, the rising cost of housing, or the prevalence of payday lenders and other high cost loans? Heavy topics, but so essential for understanding personal finance's role in greater society. This three-tiered application problem set can be used to differentiate or scaffold the learning. Level 1 -- Analyze two historgrams about student debtLevel 2 -- A tactile card sort using housing cost data, and then a deeper dive into histograms comparing mo
Subjects:
Grades:
9th - 12th
Types:
CCSS:
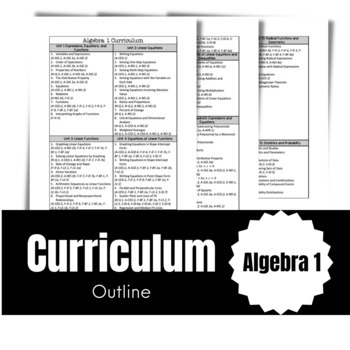
Algebra 1 Curriculum Outline
This product is associated with the content that goes with the Algebra 1 Curriculum. This also includes the Common Core Standards that go with each section in each unit. Unit notes, worksheets, reviews, and tests will be posted in the next few weeks. I will also link them here.
Subjects:
Grades:
9th - 10th
CCSS:
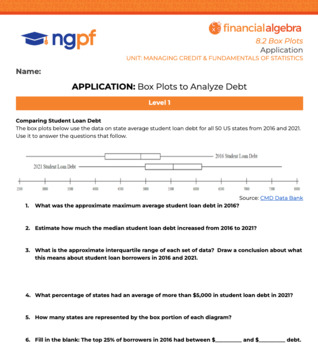
Box Plots to Analyze Debt
Whether it's fake data -- outstanding mortgage balances in Nicetown and Coolsville -- or real data -- student loans for all 50 states -- box plots are a great way to analyze what's happening with debt. This three-tiered application problem set can be used to differentiate or scaffold the learning. Level 1 -- Answer questions based on 2016 and 2021 student loan debt box plotsLevel 2 -- Input data to an online box plot maker to analyze mortgage debtLevel 3 -- Use a spreadsheet template to build y
Subjects:
Grades:
9th - 12th
Types:
CCSS:
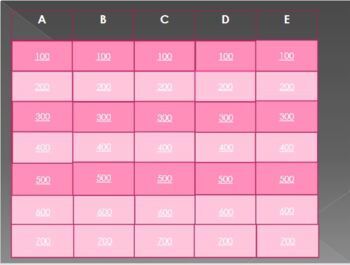
Jeopardy Game for Statistics and Probability Topics
Run out of time to create an engaging activity for your Subject Matter : Statistics and Probability? Don't worry I got you. I offer you this jeopardy game slideshow that will surely engage your students to learn this topic.In this game, there is a board containing boxes with different amounts/scores.To play this game, you can do the following:1st:Group the students2nd: Tell the students that each boxes corresponds to different questions, if they are able to give the correct answer in a particula
Subjects:
Grades:
11th
Types:
CCSS:
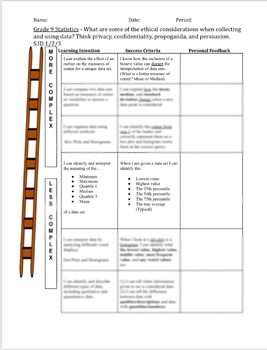
HS Statistics Lesson Plans and Learning Ladder Progression Sheet(w/ handouts)
Get your 9th-grade statistics lessons on track with our digital product! Our learning ladder progression sheet and two weeks of lesson plans covering S.ID.1, S.ID.2, and S.ID.3 standards are available for instant download in a convenient PDF format. Our comprehensive curriculum ensures your students are engaged and challenged as they build a strong foundation in statistical analysis. Optimize your classroom today and unlock your students' full potential with our innovative and effective teaching
Subjects:
Grades:
8th - 10th
Types:
CCSS:
Showing 1-24 of 43 results

