348 results
12th grade graphing resources for Microsoft PowerPoint
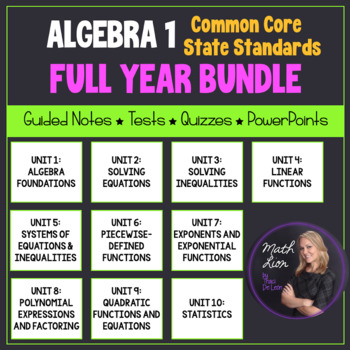
Algebra 1 Curriculum - Full Year EDITABLE Unit Plans | Bundled for Common Core
This is a great bundle that covers concepts for a full year Algebra 1 course! 76 lessons are included! Documents are EDITABLE!Included:- Overview of the common core alignment tandards (Two 18-week guides) (PDF and Word) - Overview of the common core alignment (PDF)- Guided notes for 76 lessons (PDF and Word)- PowerPoint presentations (aligned with guided notes) (PPTX)-10 Mid-unit quizzes (PDF and Word)-10 Unit tests (PDF and Word)-2 Semester exams (PDF and Word)Each lesson contains a learning
Grades:
8th - 12th
CCSS:
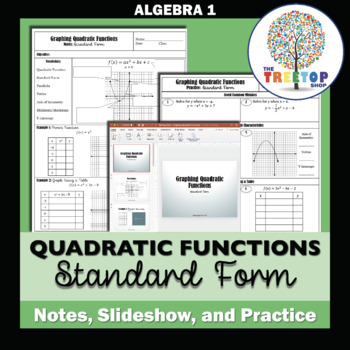
Graphing Quadratic Functions (Standard Form) - Notes, Slideshow, and Practice
Students will:-Identify key features of graphs of quadratic functions.-Graph quadratic functions in standard form using a table of values.-Graph quadratic functions from standard form by finding the axis of symmetry, vertex, and y-intercept.Includes everything you need to teach this lesson in one folder:-PDF of guided notes (with key)-Editable PowerPoint and Google Slide presentation for use with guided notes-PDF of practice problems (with key)Copy the guided notes for students and present the l
Subjects:
Grades:
9th - 12th
CCSS:
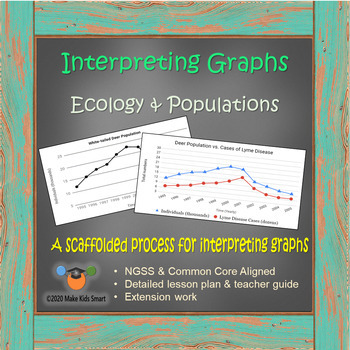
Interpreting Graphs - Ecology & Populations (17 slide Distance Learning Packet)
Teach students how to analyze and interpret line graphs, describe trends, and discuss data using a proven 5-step process. This is 2-3 periods of work suitable for distance learning and meant to move gradually from teacher led to independent work.All materials are found within this 17 page editable power point which is suitable for distance learning. Slides can be shared individually for student completion or shared as a full packet.Please check the preview to see exactly what you are downloading
Subjects:
Grades:
6th - 12th
NGSS:
HS-LS2-7
, MS-LS2-2
, MS-LS2-5
, HS-ESS3-2
, MS-LS2-4
...
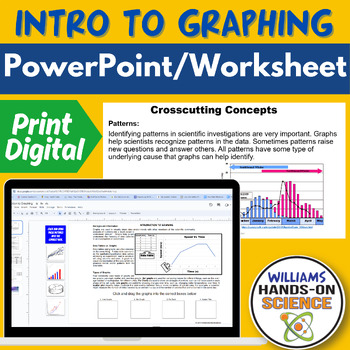
NGSS Intro to Graphing Crosscutting Concepts Science & Engineering Practices
If you are teaching your students how to understand graphs and want to hit NGSS Science and Engineering Practices and Crosscutting Concepts, this resource is a great scaffold or lecture! This resource is great as a warm up/bell ringer, lecture, homework or sub plan.This resource includes the following:-Student Handout-Key-Editable PowerPoint for lecture and/or scaffold This resource includes the following Concepts:-Interpreting Graphs-How to make a graph-Difference between data tables and graph
Subjects:
Grades:
6th - 12th
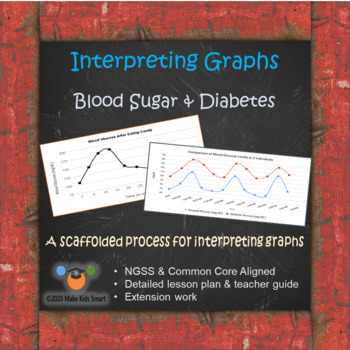
Interpreting Graphs - Blood Sugar & Diabetes (15 slide Distance Learning PPT)
Teach students how to analyze and interpret line graphs, describe trends, and discuss data using a proven 5-step process. This is 2-3 periods of work suitable for distance learning and meant to move gradually from teacher led to independent work. All materials are found within this 15 page editable power point which is suitable for distance learning. Slides can be shared individually for student completion or shared as a full packet.Please check the preview to see exactly what you are downloa
Grades:
6th - 12th
CCSS:
NGSS:
MS-LS1-2
, MS-LS1-3
, HS-LS1-2
, HS-LS1-3

The Scientific Method-Red-Nosed Reindeer Mystery-Christmas-Powerpoint
Follow Roger the elf as he applies the Scientific Method to question the origin of the red-nosed reindeer.
Terms/Topics covered in this presentation include: The Seven Steps of the Scientific Method, How to Applying the Scientific Method, hypothesis, variables, controls, data, Recording and Analyzing Data, Data tables, Graphing, Drawing Scientific Conclusions, and hidden variables.
This would be a great review, but can also be a stand alone lesson. Aside from providing an entertaining a
Subjects:
Grades:
4th - 12th
Pasta Activity - An Introduction to Graphing Sine and Cosine
This activity introduces graphing sine and cosine functions in a fun way! By using uncooked pasta, students will use the unit circle to discover the shape, amplitude, and period of the sine and cosine graphs.
The PowerPoint walks students through the activity and illustrates the shape of the graph on sine and cosine, amplitude and period and concludes with discussion questions.
Subjects:
Grades:
9th - 12th
Editable Student Goal Tracking Book
These mini goal books are the perfect way to help your students keep track of their own goals. These books help increase student motivation and self awareness as they create their own personal goals and track their own progress.Here's what's included:Page 3: cover page options. This page is editable. Click on 'add text box' to add your students' names to their books.Page 4: Goal tracking sheets. Print as many of these pages as you need. This is also editable if you wish to type the goals in. Pag
Subjects:
Grades:
1st - 12th
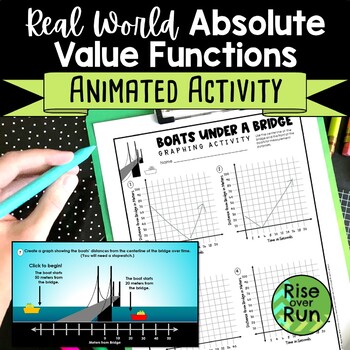
Real World Absolute Value Functions Activity
Challenge students to use absolute value graphs and equations for modeling real world situations! In the animated PowerPoint provided, students watch boats move across the screen and under a bridge. Using a stopwatch (or their phones), they time the movements. They create a graph showing each boat’s distance from the bridge. Then they determine each function and x-intercept (or when the boat passes under the bridge). 8 animations are provided. They begin simple but progress in difficulty. This
Subjects:
Grades:
9th - 12th
CCSS:
Also included in: Algebra 1 and 8th Grade Math Curriculum Bundle for Entire Year
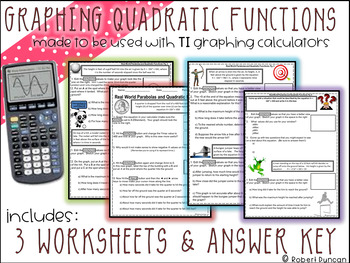
Graphing Quadratic Functions Worksheet for TI Calculators
This is sort of an exploration type activity to help students become more familiar with the window and trace functions of TI calculators. The questions are all application type problems and my goal was to create a worksheet that would let students go at their own pace without me giving direct instruction that was either too fast or too slow for them.
File includes: 4 worksheets to be used with TI Graphing Calculator and detailed answer key.
I found that letting students work with a partner
Subjects:
Grades:
8th - 12th
Types:
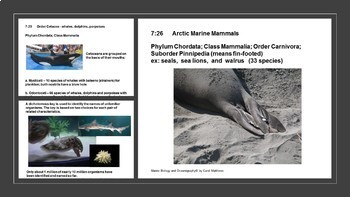
Polar Seas - Ocean/Marine Biology Unit 7
Polar Seas are unique habitats that influence climate and account for the diverse characteristics of polar animals such as Pinnipeds, Cetaceans and Penguins. They will use technology research skills, practice graphing from a computer program such as Excel, and to use photoperiods as a predictor to hemisphere location. Taxonomy is review by having students develop their own dichotomous key.Unit curriculum includes these bookmarked sections:IntroductionStudent SyllabusTeacher Pacing guideLesson Pl
Subjects:
Grades:
10th - 12th
Also included in: Marine Biology and Oceanography Full Year, 12 Unit Bundle
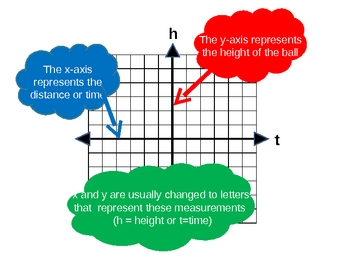
Introduction to Quadratics: Parabolas in the Real World
This a presentation to be used at the beginning of a unit introducing quadratic equations and parabolas. It answers that never-ending question of "How is this used in real life?" by showing pictures and examples such as parabolas in nature, architecture, and sports. There are also word problems that use these same type of real world examples. My intention to close the lesson is that students come up with their own real-life examples that may be used on a later assessment.
Subjects:
Grades:
8th - 12th
Types:
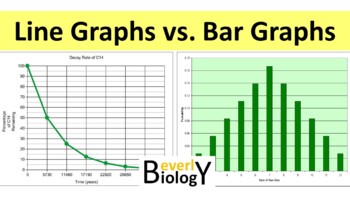
How to Make a Graph PowerPoint: Bar vs Line Graphing
This PowerPoint explains the basic properties of a line graph verses a bar graph. There is also a free handout included for your students to use as you present the lesson.This is NOT the typical bullet point PowerPoint. This is very much an animated, multimedia presentation filled with engaging images and animations to better enhance learning. Better yet! You can preview this entire PowerPoint prior to purchase on my YouTube channel to make sure it suits your needs:Preview on YouTubeThere are 3
Subjects:
Grades:
6th - 12th
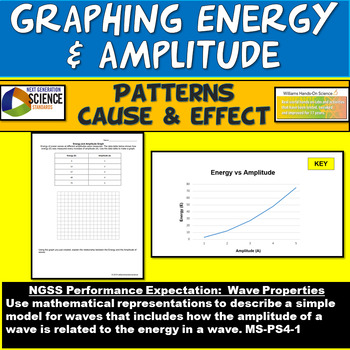
NGSS MS-PS4-1 Graphing Energy & Amplitude Worksheet & PowerPoint
If you are teaching your students how to understand graphs and how the amplitude of a wave is related to the energy in a wave (NGSS Performance Expectation MS-PS4-1), this resource is a great scaffold or assessment! Students discover that as the amplitude of a wave increases the energy increases exponentially, meaning that a small increase in amplitude causes a larger increase in energy. This resource is great as a warm up/bell ringer, homework or sub plan.Take a look at these two graphing waves
Subjects:
Grades:
6th - 12th
NGSS:
MS-PS4-1
Linear Vs Exponential Functions Walk Around or Gallery Walk with a Riddle
This walk around activity is amazing. It keeps ALL students engaged, having fun, while being assessed all at the same time. Students start at any problem and locate the answer on another page which includes a letter which will spell out a riddle at the end. Check out the preview page and how it leads you to the next problem. Don’t worry, detailed instructions are provided.
Out of all the activities I do in the classroom, this is my favorite thing to do. My students get excited when they
Grades:
8th - 12th
Types:
Also included in: Algebra I Math Bundle of Walk Arounds or Gallery Walks with Riddles
Piecewise-Defined Functions (Algebra 1 - Unit 6) | Bundle for Common Core
This is a great unit that covers a Piecewise-Defined Functions unit in an Algebra 1 course! 5 lessons are included!Documents are EDITABLE!Included:- Overview of the common core alignment (PDF)- Guided notes for 5 lessons (PDF and Word)- PowerPoints that coordinate with the guided notes (PPTX)- Mid-Unit Quiz (PDF and Word)- Unit Test (PDF and Word)- Pacing Guide (PDF and Word)Each lesson contains a learning scale, warm up (do-now or bell ringer), key concepts, vocabulary, and examples for student
Grades:
7th - 12th
CCSS:
Algebra 1 Curriculum - Semester 1 EDITABLE Unit Plans | Bundle for Common Core
This is a great bundle that covers concepts for the first semester of an Algebra 1 course! Documents are EDITABLE!!!!Included:- Pacing guides with common core state standards (18-week guide) (PDF and Word)- Overview of the common core alignment (PDF)- Guided notes for 37 lessons (PDF and Word)- PowerPoint presentations (aligned with guided notes) (PPTX)- 5 Mid-unit quizzes (PDF and Word)- 5 Unit tests ((PDF and Word)- Semester exam (PDF and Word)Each lesson contains a learning scale, warm up (do
Grades:
8th - 12th
CCSS:
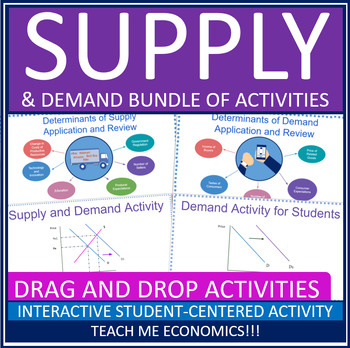
Supply and Demand Price Ceilings & Floors for Economics, Economic Google Slides
Are you looking for a way for your students to learn about supply and demand, market equilibrium, price floors and ceilings, the determinants of supply and demand and prices? This product includes all of the information they will need to apply the principles of supply and demand. These activities can be used to teach supply and demand for high school Economics or as an enrichment activity.Included are interactive Google Slides activities.Each of these activities are provided as a Google Slides a
Subjects:
Grades:
9th - 12th

Desmos Graphing Project (Review)
This project is meant as a review of linear functions as well as transformations in the coordinate plane (translations, reflections, rotations, dilations). Students get to choose which transformation to perform, so it does not "review all transformations". Students use Desmos to outline a letter, usually an initial, (restricting domain and range) and then transform it within Desmos (in a table). For easier projects: pick transformations for students to perform (translations, dilations) and walk
Grades:
8th - 12th, Higher Education, Adult Education
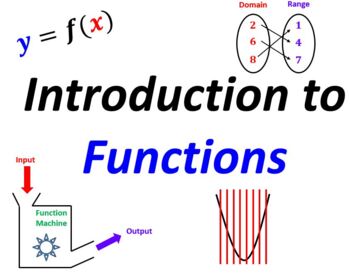
Math 3/Alg 2 Bundle-Unit 1 Intro to Functions (Linear, AV, Piecewise) & Inverses
This bundle includes various instructional MS PowerPoint (PPT) slidepacks that I initially use when covering the content area titled: Introduction to Functions including Linear, Absolute Value, Piecewise Functions and Inverse Functions. The following slidepacks are included in this bundle:Introduction to FunctionsKey Characteristics of FunctionsLinear Function TransformationsAbsolute Value Function TransformationsAbsolute Value Equation Solution SummaryPiecewise Function Solution SummaryInverse
Subjects:
Grades:
10th - 12th
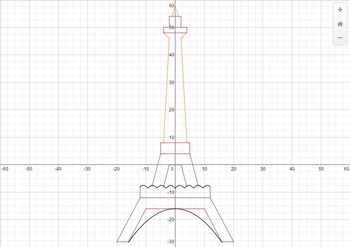
Linear Equations Project - Graphing the Eiffel Tower
Discover linear equations the fun way. This is a 5 day project that is ready to use. Implementing it in your class will be as easy as pi.
Students will need access to a computer or iPad. They will use a powerful online graphing calculator to create a drawing of the Eiffel tower via www.desmos.com.
Students will learn about:
Writing linear equations in point-slope form
Writing linear equations in slope-intercept form
Writing equations of parallel lines
Graphing horizontal and vertical lines
Subjects:
Grades:
8th - 12th
CCSS:
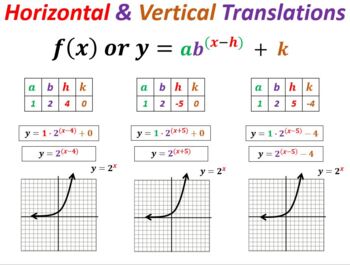
Math 2&3 / Algebra 2 / Precalculus Function Bundle-All Functions Transformations
This bundle includes eleven (11) separate MS PowerPoint presentation slide packs that review the transformations associated with the following eleven (11) separate functions: Absolute Value Function TransformationsLinear Function Transformations Quadratic Function TransformationsExponential Function TransformationsCubic Polynomial TransformationsQuartic Polynomial Function TransformationsLogarithmic Function TransformationsRational Function TransformationsRadical (Square Root) Functions Transfor
Subjects:
Grades:
9th - 12th
CCSS:
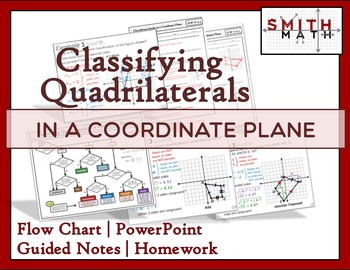
Classifying Quadrilaterals PowerPoint Lesson
This lesson and its accompanying resources were developed to help students classify quadrilaterals in a coordinate plane. This lesson is built around a flow chart. Flow charts in general help students think through complicated ideas, and exposure to them in high school will prove useful for those who later enter fields like engineering and computer science. Included in this resource:1) Flow Chart, which is available as a free resource (Classifying Quadrilaterals Flow Chart)2) A PowerPoint, comp
Grades:
9th - 12th
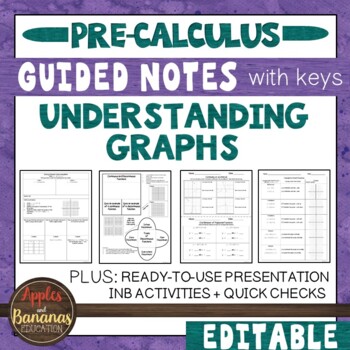
Understanding Graphs - Guided Notes, Presentation, and INB Activities
This flexible resource on Understanding Graphs allows students to either build interactive math notebooks with guided notes (keys included) and foldable activities OR use the included presentation handouts (keys included) with the PowerPoint presentation for focused instruction. Quick checks for understanding (keys included) help to determine how well your students understand the material as you go. Choose what works best for your class and modify to make the content fit your needs. Notes are de
Subjects:
Grades:
9th - 12th
CCSS:
Also included in: Pre-Calculus Interactive Notebook Activities and Guided Notes Bundle
Showing 1-24 of 348 results


