7 results
Graphing projects on sale
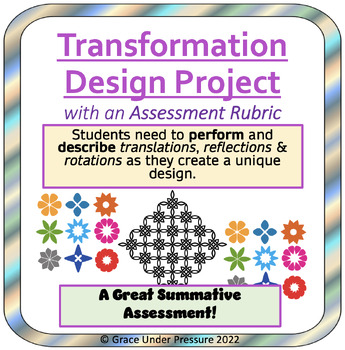
Transformation Geometry Project with an Assessment Rubric: Gr 6-8 Geometry
This creative and fun math geometry project assesses students’ ability to perform and describe 3 kinds of transformations: translations, rotations, and reflections. It is a great summative assessment for your transformation unit!It will take several work periods for students to create their design and write or type a detailed explanation of the process. This is how I can really see if they understand the concepts. I encourage students to describe their process using specific mathematical vocabul
Subjects:
Grades:
6th - 8th
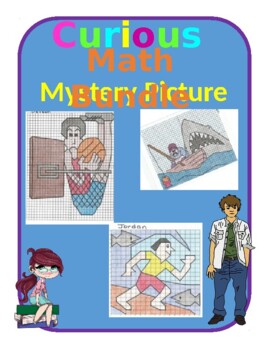
Bundle- 4Q Brian, 4Q Deveon, and 1Q Jordan
This bundle consist of 4 Quadrant Brian Shark Attack, Deveon Basketball Failure, and Jordan the Surfer. Curious Math provides fun and exciting graphing practice for your students. They won't know what the mystery picture is until they have graphed and connected most of the points. The suspense will drive them to complete the picture. Have the students color it, put it on a piece of construction paper for a frame, and post it in your favorite place in your classroom or hallway. Other students wi
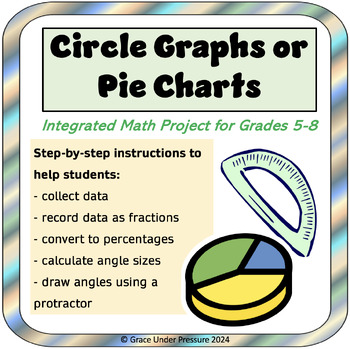
Circle Graphs or Pie Charts Math Project: Fractions, Percent, Angles, Data
This fun math project for middle grades students (grades 5-8) includes clear step-by-step instructions to show your students how to make a circle graph or pie chart. Tasks include: - Writing a survey question - Collecting data from exactly 25 people - Recording the results as a fraction - Calculating an equivalent fraction with a denominator of 100 (percentage) - Using the percentage (written as a decimal) to find the size of the angle (percentage x 360) - Drawing angles with a protractor - Lab
Grades:
5th - 8th
Types:
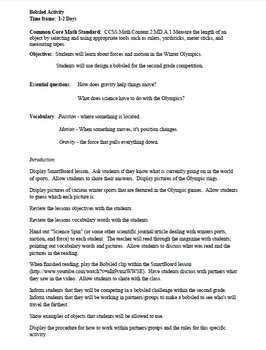
STEM Bobsled Olympic Lesson
Students are to work in groups or pairs and design a bobsled. Students will be provided with a toilet paper role, two popsicle sticks, two pipe cleaners, and 1 foot of masking tape. If students wish to brings small things from home, that is okay. Allow students to think through their design. Allow a trial run, and then allow modifications for improvement after the trail run. Hold a final event and display the gold, silver, and bronze winners for this event. This event is fun and engaging.
Subjects:
Grades:
1st - 8th
CCSS:
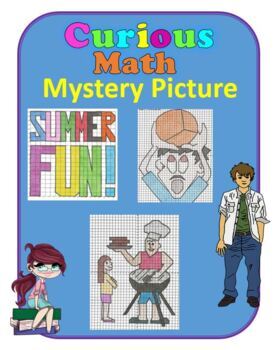
Summer Bundle Gilbert and Ariana, Alan, and Reynaldo Coordinates
This bundle consist of 4 Quadrant Gilbert and Ariana BBQ, Reynaldo the Basketball Player, and quadrant 1 Alan Summer Fun. Curious Math provides fun and exciting graphing practice for your students. They won't know what the mystery picture is until they have graphed and connected most of the points. The suspense will drive them to complete the picture. Have the students color it, put it on a piece of construction paper for a frame, and post it in your favorite place in your classroom or hallway.
Subjects:
Grades:
6th - 10th
Types:

Stock Market in the Classroom
This assignment includes multiple areas of the math curriculum. These include: number sense and numeration (mathematical computation), data management (graphing), and transformational geometry.
Over a 10-day period students will select one stock to invest in and track. Using the included investment tracker your students will record how their stock is performing. They will keep records of, and show all of their work and mathematical calculations. They will also provide visual representations of
Grades:
6th - 8th
Types:
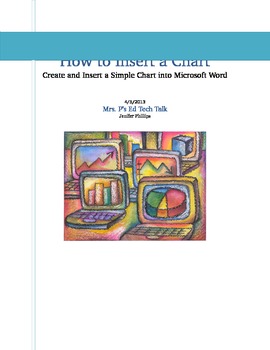
How to Insert a Chart: Microsoft Word
This step by step tutorial shows you how to create and insert a simple chart into Microsoft Word; simple enough for upper elementary students
Grades:
4th - 6th, Adult Education, Staff
Types:
Showing 1-7 of 7 results


