1,036 results
High school Women's History Month statistics internet activities
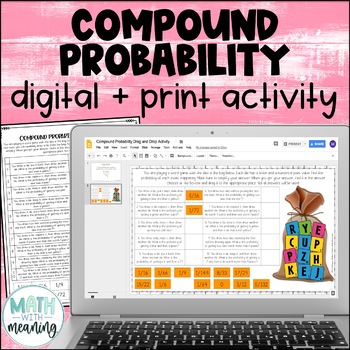
Compound Probability Digital and Print Activity for Google Drive and OneDrive
Looking for an engaging, no-prep activity to practice finding the probability of compound events? Students will use the included image to find the probability of 10 compound events, including both independent and dependent events. They will then find their answer from the answer choices at the bottom and drag it to the appropriate spot. Please view the preview file to make sure that this activity is appropriate for your students.This product includes the following:A link to the digital activity
Subjects:
Grades:
6th - 9th
CCSS:
Also included in: Middle School Math Digital and Print Activity Bundle Volume 1

Women Scientists Webquest Activity | Women in Science Women's History STEM
Highlight women scientists and STEM leaders with this webquest activity during Women's History Month, or throughout the school year!This webquest makes it easy to teach about women STEM leaders from a diverse range of backgrounds who have influenced the world!Students will explore student appropriate educational articles and an interview video to learn about the work of Marie Curie, Sally Ride, Katherine Johnson, Chien-Shiung Wu, Mary Jackson, Rachel Carson, and Dorothy Vaughan. Students will th
Grades:
5th - 12th
Types:
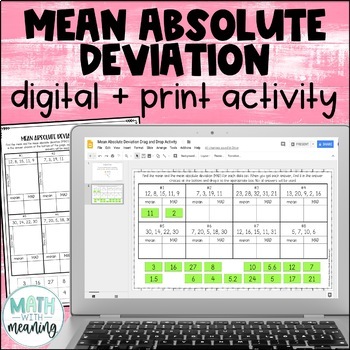
Mean Absolute Deviation MAD Digital and Print Activity for Google Drive
Looking for an engaging, no-prep activity to practice finding the MAD? Students will find the mean and mean absolute deviation for 8 data sets. They will then then find their answer from the answer choices at the bottom and drag it to the appropriate spot. Each data set contains 4-5 numbers. The mean of each data set is a whole number. Please view the preview file to make sure that these types of problems are appropriate for your students.This product includes the following:A link to the activit
Subjects:
Grades:
6th - 9th
CCSS:
Also included in: Middle School Math Digital and Print Activity Bundle Volume 2

Gender Roles & Stereotypes in Mid-20th Century Television: 6 Classic Shows!
In this engaging and interactive resource on Gender Roles in 1950s-60s television, students investigate 6 classic television shows to learn about gender roles and stereotypes in mid-20th century TV. Students watch short video clips from Leave it to Beaver, Father Knows Best, I Love Lucy, The Mary Tyler Moore Show, All in the Family, and The Jeffersons to learn about gender roles and stereotypes, and how some shows reinforced these views while others challenged them. For each video, students "r
Grades:
6th - 10th
Types:

The Yellow Wallpaper Digital Escape Room
Your students are going to love deciphering and solving puzzles in this 360° digital escape room. This activity is designed to work for a laptop, tablet, or smart phone. Students will solve a series of clues based on the story “The Yellow Wallpaper” by Charlotte Perkins Gilman in order to crack the master lock and escape the room. This game entails reading comprehension skills, finding textual evidence, and making inferences!Included in this download are teacher instructions, student instruction
Grades:
9th - 12th
Types:
Also included in: The Yellow Wallpaper Unit Bundle
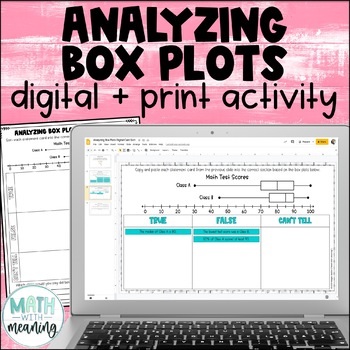
Box and Whisker Plot Digital and Print Card Sort - Reading and Analyzing
Looking for an engaging, no-prep activity to practice reading and analyzing box plots? Students will look at a double box plot and determine if statements about it are true, false, or if they can't tell from the information given in this fun digital and print activity.This activity includes statements about the minimum, maximum, median, quartile 1 (Q1), quartile 3 (Q3), interquartile range (IQR), and range of the box plots, along with statements about the percentages represented by a particular
Subjects:
Grades:
6th - 9th
Also included in: Middle School Math Digital and Print Activity Bundle Volume 3

The Yellow Wallpaper Unit Bundle
This bundle includes 3 products for the short story "The Yellow Wallpaper" by Charlotte Perkins Gilman:1. Literary Analysis: includes an activating strategy, background info, and reading comprehension questions.3. 360° Digital Escape Room: Students will solve a series of clues based on the story. This game entails reading comprehension skills, finding textual evidence, and making inferences.4. One Pager Project: Students imaginatively blend their written ideas with colorful images based on infor
Grades:
8th - 12th, Higher Education, Adult Education
Types:
CCSS:
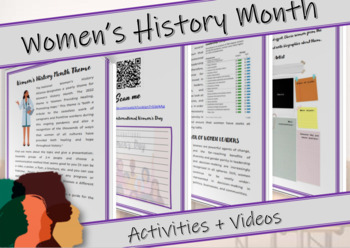
Women's History Month | The Role of Women in the Past, Present and Future
Women's History Month is a month of great importance to all of us. This month should serve to commemorate each contribution and each victory of women and to reflect on the importance they have within society and the obstacles that still remain to be overcome.This resource can be used both physically and digitally. It can be used for both Women's History Month and International Women's Day. It includes: - Cover page. - How to do Page. p1: - Introduction. p2: - Why Do We Celebrate Women's History
Grades:
8th - 12th
Types:
Also included in: Women's History Month | For All Ages | English + Spanish
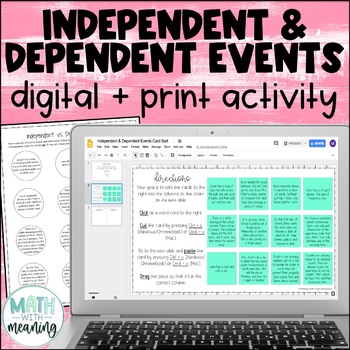
Independent and Dependent Events Digital Print Card Sort - Compound Probability
Looking for an engaging, no-prep activity to practice identifying independent and dependent events? Students will read 12 sets of compound events and determine if they are independent or dependent events. Many examples of real-world events are included. This is a great activity for students learning compound probability who struggle with differentiating between independent and dependent events. Also included is a printable graphic organizer that is perfectly sized for interactive notebooks. Plea
Subjects:
Grades:
6th - 9th
CCSS:
Also included in: Middle School Math Digital and Print Activity Bundle Volume 2
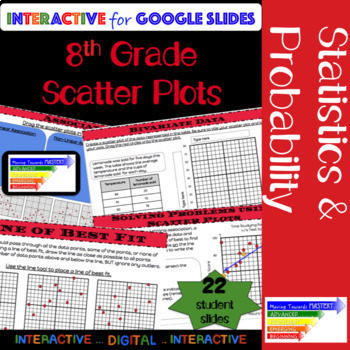
8th Grade Math Scatter Plot: Guided Interactive Lesson
Extensive ALL digital guided lesson for constructing and interpreting scatter plots.The slides are scaffolded to build understanding. Students will progress from identification of terms to making predictions involving bivariate data. The guided slides will begin with identification, move towards assisted analysis, and conclude with independent practice.Slides include...♦ Definitions and Visual Representations♦ Identification and Use of Terms→ Bivariate Data→ Scatter Plot→ Linear, Nonlinear, &
Subjects:
Grades:
8th - 10th
Types:
CCSS:
Also included in: 8th Grade Math Common Core Growing Bundle
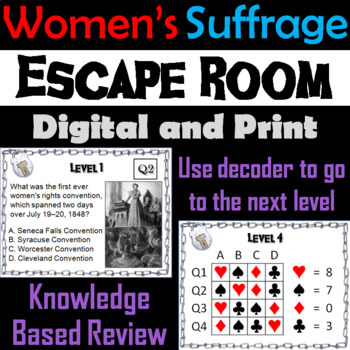
Women's Suffrage Activity Escape Room (Woman's Rights Movement)
This breakout escape room is a great way for students to test their knowledge about the major figures, events and terms regarding women's suffrage.Important: (How to Make Completely Digital)This product normally requires the printing of the questions to accompany a digital form for students to input answers. But if you follow a couple simple steps, this can be made entirely digital! Just use the following tool:https://smallpdf.com/split-pdf(choose "extract pages")to extract the pages containin
Grades:
6th - 10th
Types:
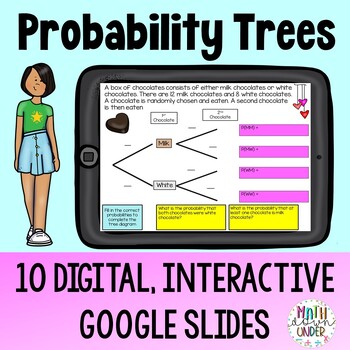
Probability Tree Diagrams Practice - Digital Activity using Google Slides
This resource is a set of 10 Google Slides that practices Probability Tree Diagrams. Complete with attractive graphics, students will solve compound probability problems (independent and dependent events included) by filling in the missing spaces on a probability tree. Starting with structured scaffolding, students are introduced to the process of creating probability trees by clicking and filling in the blanks on the Google Slide. This approach builds confidence and ensures students grasp the f
Subjects:
Grades:
6th - 9th
Also included in: Probability Tree Practice Bundle - PDF & Digital
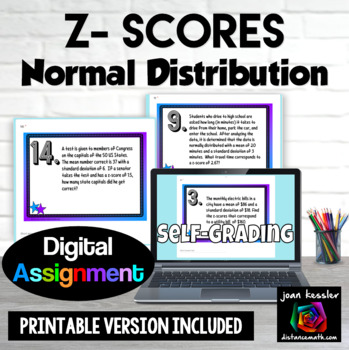
Normal Distribution Z-Scores Digital plus Print
Your students will get extra practice and gain fluency learning about z-scores and the Normal Distribution with both a self-grading digital resource and a PDF printable version. There are 16 applications to solve with a mix of multiple choice and free response including: finding the z-scorefinding the standard deviation knowing the z-score, mean, and data point finding the mean knowing the z-score, data point, and standard deviationinterpreting the z-score. Your download includes:PDF with link
Subjects:
Grades:
9th - 12th
Types:
CCSS:
Also included in: Probability and Statistics Algebra 2 Unit 11 Activity Bundle

Measures of Center and Spread |Mean, Median, Standard Deviation, +|Google Forms™
Included in this Product: 100% Self-Grading Assessment or Homework using Google Forms™ - Measures of Center and Spread - Mean, Median, Range, Interquartile Range, Standard Deviation - 26 Questions each (9 multiple choice, 15 free response, and 2 checkbox). The default multiple choice answer order is generally set to be "shuffled" to prevent cheating. However, this can be edited. 2 similar versions for the price of 1!! Having a second version of the form allows for retakes and also gives you opt
Subjects:
Grades:
8th - 12th
Types:
CCSS:
Also included in: Algebra 2 Google Forms™

TED Talk: My Identity is a Superpower- Not an Obstacle (America Ferrera)
America Ferrera's TED Talk, My Identity is a Superpower- Not an Obstacle, examines the need for more authentic representation of cultures in media. She shares from her personal accounts as a Latina actress and how stereotypes or her identity impacted her career. This talk would be beneficial when discussing the need for more diversity in media, a more accurate representation of minorities in media, and/or Latina History. One could also use this during Latinx Heritage Month or during a unit on
Grades:
6th - 12th
Types:
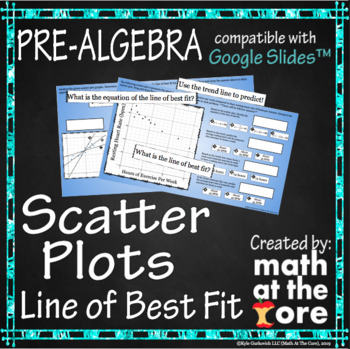
Scatter Plots - Line of Best Fit for Google Slides™
- Great for online and distance learning! Created to be compatible with Google Slides™!- In this digital activity, students will analyze scatter plots and determine the line of best fit. They will use the line of best fit and the equation of that line to predict values. They should be familiar with writing the equation of a line.- This activity includes 20 different problems involving analyzing scatter plots. Students will start with determining which line is the line of best fit for the given s
Subjects:
Grades:
7th - 9th
Types:
Also included in: Statistics - Unit 7 - BUNDLE for Google Slides™
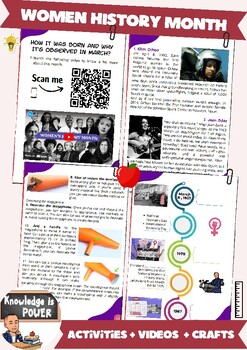
Women History Month | 10 inspiring Latinas who made history | Activities + Video
Women's History Month is an annual observance in March dedicated to celebrating the vital role of women in history. Additionally, recognizing Latin American women is important because it acknowledges and celebrates the rich cultural, social, and historical contributions of women in the diverse countries that make up Latin America. By highlighting their achievements, it helps challenge stereotypes and promotes a more accurate understanding of the roles women play in society. Let's learn more abou
Grades:
8th - 12th
Types:
Also included in: Women History Month | English + Spanish | For All Ages

Hidden Figures at NASA Webquest | STEM Math Women's History Black History Month
Learn about Katherine Johnson, Mary Jackson, Dorothy Vaughan, and other Hidden Figures at NASA during Black History and Women's History Months with this engaging webquest activity! Students will explore five digital resources from NASA, including student appropriate educational articles and an interview video, to learn about the work of Katherine Johnson, Mary Jackson, Dorothy Vaughan, and Annie Easley. Students will then answer questions based on these resources to capture what they learned! Li
Grades:
5th - 12th
Types:
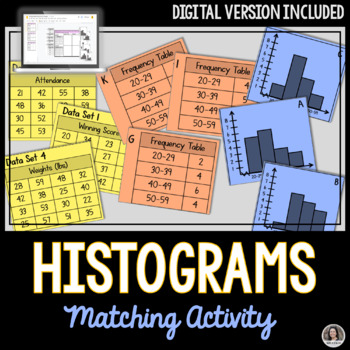
Histograms Matching Activity, Print and Digital Google Slides™
Practice makes perfect! This matching histograms activity is an ideal assignment for students to demonstrate their understanding of Histograms. Students match the data set to their corresponding frequency tables and histogram graphs. There will be 6 matches made when complete. Included:A pdf with a link to make a copy of the Interactive Google Slides™ for your own Google Drive™A printable version for students to sort and match.Student Response SheetAnswer keyDigital Version:Go paperless with thi
Subjects:
Grades:
7th - 12th
Types:
Scatter Plot Trend Line of Best Fit Correlation Coefficient Practice Task Cards
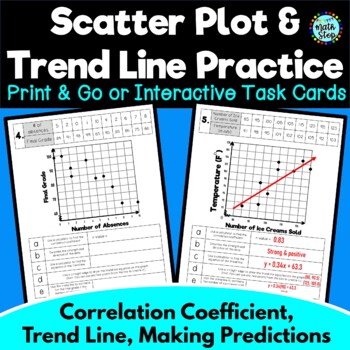
Students are given five different scatter plot scenarios (for example, temperature and the number of ice creams sold) with a table and graph already created. Their job is to use a calculator to find the correlation coefficient and equation of the line of best fit. Then for each one, they are asked to:➤ State the correlation coefficient/r-value.➤ Describe the strength and direction of the scatter plot.➤ Find the equation of the line of best fit/trend line.➤ Draw the line of best fit on the scatte
Subjects:
Grades:
7th - 10th
Types:
Mes de la Historia de la Mujer | El Rol de la Mujer - Del Pasado hacia el Futuro
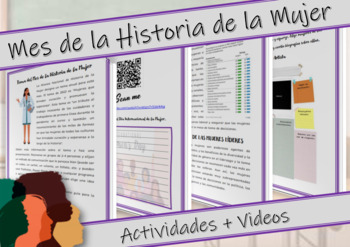
Women's History Month is a month of great importance to all of us. This month should serve to commemorate each contribution and each victory of women and to reflect on the importance they have within society and the obstacles that still remain to be overcome.This resource can be used both physically and digitally.It can be used for both Women's History Month and International Women's Day.It includes:- Cover page.- How to do Page.p1:- Introduction.p2:- Why Do We Celebrate Women's History Month?p3
Grades:
8th - 12th
Types:
Also included in: Women's History Month | For All Ages | English + Spanish
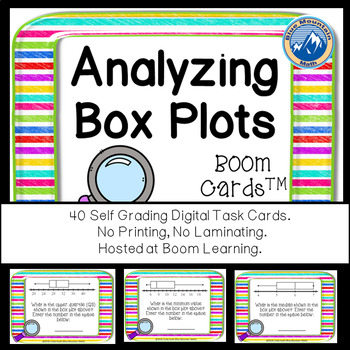
Analyzing Box Plots Boom Cards--Digital Task Cards
Boom Cards™ are a great way for students to practice skills analyzing Box Plots--formerly called Box and Whisker Plots. You can assess their understanding and students can play again to keep improving. This set uses a variety of different plots and asks question about lower quartile, upper quartile, median, interquartile range, range and outliers. This set of Boom Cards features 40 different Digital Self-Checking Task Cards. (No printing, cutting, laminating, or grading!)
Boom Cards live in the
Subjects:
Grades:
7th - 10th
Types:
CCSS:
Also included in: Algebra 1 Bundle Boom Cards--Digital Task Cards Distance Learning
Statistics Confidence Intervals for the Mean Digital plus Print
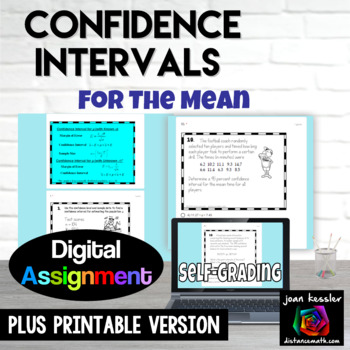
Build your students' skills with this Confidence Intervals for the Mean Assignment in both digital and printable formats. The digital resource is designed with Google Forms™ which means it is NO PREP and the assignment will be graded automatically for you. The Printable version contains the same questions in a free response worksheet format.Topics Included:18 Task Cards for students to practice constructing confidence interval for the mean using the z - distribution and the t - distribution.Card
Subjects:
Grades:
10th - 12th, Higher Education
Types:
CCSS:
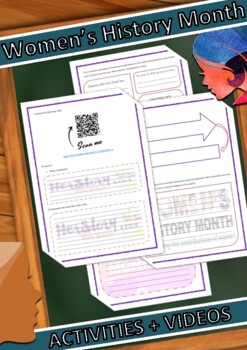
Women's History Month Activities + Videos + Debate
In recent years, the role of women in society has been gaining the place it truly deserves. But how was it achieved? And what things do we still need to achieve to achieve greater equity? These are questions that should be asked in every classroom in the world. This is what this resource is looking for.It can be used both physically and digitally.It includes:- Cover Page.- How to do page.p1:- Text: "About the Month of the History of the Woman".p2:- Make a timeline.- Questions of personal express
Grades:
6th - 12th
Types:
Also included in: Women's History Month English + Spanish | Activities + Videos + Debate
Showing 1-24 of 1,036 results


