26 results
Statistics lessons for Easel
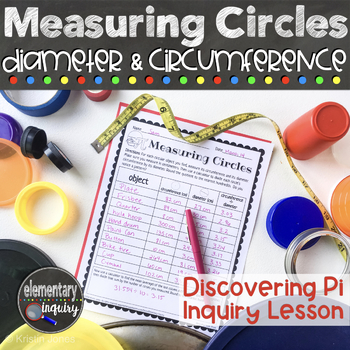
Measuring Circle Circumference & Diameter to Discover Pi - Pi Day Inquiry Lesson
Have fun finding Pi by measuring the circumference and diameter of circles of all sizes! Students will calculate the ratio of the length of a circle’s diameter to its circumference. They’ll discover that the circumference is always a little more than three times as long as the diameter. This full lesson plan and teacher script will help you lead an inquiry based investigation and class discussion. It’s perfect for an introduction to these geometry concepts, or for a fun Pi Day activity.A full, f
Subjects:
Grades:
5th - 7th
Types:
CCSS:
Also included in: Pi Day Activities - Measuring Circles Diameter, Circumference, and Area
Interpreting Graphs for the Middle & Junior High School: Book 2
Here is another set of data graphics for your students to analyze and interpret. Using survey results from the USA Today newspaper, students will be asked to explain what the graphics are illustrating. Each activity will ask the student to identify basic information presented in each graphic and make some projections based on the data given in the survey.
The activities in this packet are a great way to improve your student’s skills in taking apart graphic displays of information. Brin
Subjects:
Grades:
4th - 10th, Adult Education
Types:
5th Grade Data and Line Plots, 30 Enrichment Projects and 30 Test-Prep Problems
No-prep, 5th grade line plots and data math practice with 30 enrichment projects and 30 review test-prep questions aligned to the 5th grade math standards. A great way to teach the data standards in a fun, engaging way. Perfect for early finishers, advanced math students or whole class practice. Print and go math enrichment! These work perfectly for distance learning as well.This resource is aligned to the 5th grade math CCSS standards: 5.MD.B.2. (However, this resource is perfectly suitable t
Subjects:
Grades:
5th
Types:
CCSS:
Also included in: 5th Grade Math Projects For Every Standard! Enrichment All-Year Bundle!
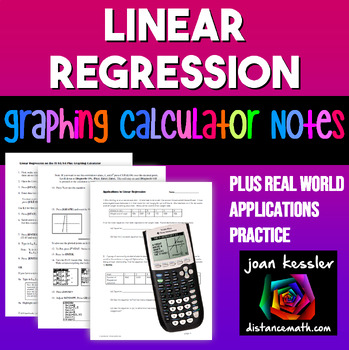
Linear Regression | TI-84 Graphing Calculator plus Applications
This clear, concise, step by step notes help your students use the TI 83 and TI 84 Graphing Calculator to enter data into lists, create a linear regression equation and to plot the equation along with the data simultaneously. Also included is a 3 page worksheet with five real world examples for students to practice. Solutions included. These can be used as Binder Notes or printed smaller for Interactive Notebooks._________________________________________________Related Products★ Quadratic Re
Subjects:
Grades:
9th - 11th, Higher Education
Types:
CCSS:
Also included in: Linear Functions and Systems Algebra 2 Unit 2 Activity Bundle
4th Grade Data & Line Plots, 30 Enrichment Projects and 30 Test-Prep Problems
No-prep, 4th Grade data and line plots practice with 30 enrichment projects and 30 review test-prep questions aligned to the standards. Great for teaching the important data standards in a fun, engaging way. Excellent for early finishers, advanced math students or whole class practice. Print and go math enrichment! These work perfectly for distance learning as well.This resource includes thirty 4th Grade Common Core data and line plots problem solving test-prep questions and 30 no-prep data and
Subjects:
Grades:
4th
CCSS:
Also included in: 4th Grade Math Projects For Every Standard! Enrichment All-Year Bundle!
4th Grade STAAR Math Data and Graphs,30 Enrichment Projects & Test-Prep Problems
No-prep, 4th grade STAAR data and graphs practice with 30 enrichment projects and 30 test-prep questions aligned to the TEKS. A great way to teach these important data standards in a fun, engaging way. Great for early finishers, advanced learners and whole class practice. Print and go math enrichment! This resource includes thirty 4th grade STAAR data and graphs problem solving test-prep questions and 30 no-prep data and graphs enrichment projects aligned to the STAAR 4th grade TEKS: 4.9A, 4.9B
Subjects:
Grades:
4th
Types:
Data Project, Crazy Data Math Enrichment Project!
Data And Graphs Enrichment Project For Upper Elementary! With this project, your students will love making up their own data based on a chosen topic from a provided list. Once they've chosen their topic from such funny themes such as "ants in the pants', they will begin creating their data graphs based on the step-by-step directions included with this project. The students will then begin creating questions for other students to answer based on the data presented in their graphs. A fun way ha
Subjects:
Grades:
4th - 5th
Types:
Also included in: Math Projects "BUNDLE"! Print and Go Math Enrichment All Year!
Halloween Math "Data and Graphs" Projects
NO-PREP! Students will love the Halloween "themed" math data and graphs projects in this resource. From bar graphs,stem-and-leaf plots, line plots to line graphs and more, the projects are a fun way to apply data skills to real-life Halloween data. With the projects in this resource, your students will be researching such data as calories in fun size candy bars to the top pumpkin producing countries in the world. I've also included an example sheet for each type of graph used in the resource
Subjects:
Grades:
4th - 5th
Types:
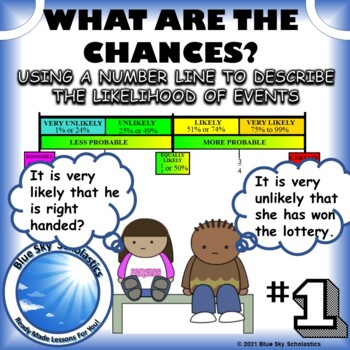
Using a probability number line to describe the likelihood of an event occurring
Your students can represent the probability as a fraction or percent and use probability terms to describe the likelihood of an outcome. These worksheets take it one step further by using a number line to match the fractions/percentages representations with the probability descriptions: impossible, unlikely, very unlikely, equally likely, likely, very likely, and certain. Your students will love the activity of describing the likelihood of sitting next to a stranger who may have won the lotter
Subjects:
Grades:
5th - 8th
Types:
CCSS:
Also included in: Probability Unit Bundle - NEW 2020 Ontario Math Curriculum Grade 6
Easy Statistics: Calculating Variance and Standard Deviation
Statistics has always been a different subject. Some people do not like it because math is involved. Some people do not like it because it is not traditional math like algebra. It has been my experience that statistics is easier by creating step-by-step instructions. And that is how this publication has been designed. In this publication I provide steps to calculating both the population standard deviation and the sample standard deviation. Although most calculators (and spreadsheets) have a fu
Subjects:
Grades:
10th - 12th, Higher Education, Adult Education
Types:
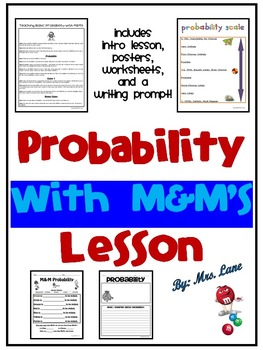
Probability with M&M's Lesson
Are you looking for a fun activity that introduces probability? Look no further! Save your valuable time because you found it!
------------------------------------------------------------------------------------------------
*THIS PRODUCT INCLUDES:
-Instructions
-Posters/Handouts (2): Probability Scale and How can data be used?
-Worksheets (4)
-Writing Prompt (1)
-Answer Keys
------------------------------------------------------------------------------------------------
*12 Pages Total.
Subjects:
Grades:
2nd - 4th
Types:
Easy Analytics: Basic Forecasting
Forecasting is a term that carries some baggage with it. When the term is used, many people often think of weather forecasting and how right or wrong it can be. Forecasting can also be used to predict anything that can be measured. There are sales forecasts, interest rate forecasts, and population forecasts to name a few. With that being said, forecasts are never perfect. We do not have crystal balls or oracles that can tell us exactly what will happen. However, usually we do not need perfect; w
Subjects:
Grades:
10th - 12th, Higher Education, Adult Education
Types:
Also included in: Easy Analytics: Basic Forecasting Bundle
Statistics, Technology, and Analyzing Data: A descriptive look.
Save money on this bundled statistical analysis product instead of purchasing the activities individually. The activities in this product will improve your student’s skills in analyzing data. Generating stem and leaf diagrams, creating frequency tables that generate histograms, and determining basic descriptive analysis such as mean, median, range, and 5 number summaries will instill confidence. The student will also be asked to determine if “outliers” exist within the data and how they aff
Subjects:
Grades:
5th - 10th, Adult Education
Types:
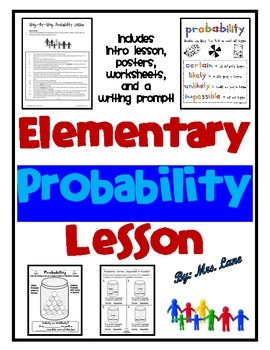
Elementary Probability Lesson
Are you looking for a basic step-by-step lesson (in the form of a teacher script) that introduces probability? Look no further! Save your valuable time because you found it!
------------------------------------------------------------------------------------------------
*THIS PRODUCT INCLUDES:
-Intro Lesson
-Posters (2)
-Worksheets (3)
-Writing Prompt (1)
-Answer Key
------------------------------------------------------------------------------------------------
*12 Pages Total
*NOTE:
Subjects:
Grades:
2nd - 4th
Types:
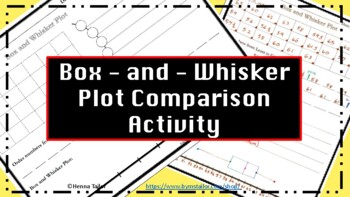
Box and Whisker Plot Comparison
This product is based off the box and whisker activity students would complete as a Do Now or station activity by furthering their understanding of box and whisker plots (analyzing data, drawing, and then comparing). A COLOR CODED answer key is provided so that you can see how to #TeachInColor !For the collection of data by your students, you can use height, how far a student can jump all starting at the same line, or even how far to throw a cotton ball -the examples are endless.
Subjects:
Grades:
6th - 8th
Types:
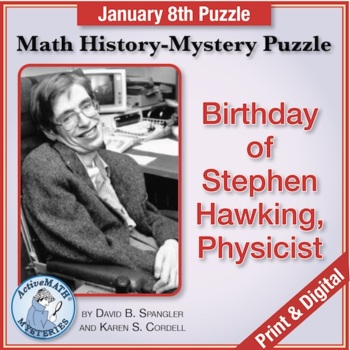
Jan. 8 Math & Science Puzzle: Stephen Hawking, Physicist | Mixed Review
January 8 of the Mystery Year was the birth date of physicist Stephen Hawking. To find the year, students solve clues about mean, measurement conversions with kilometers and astronomical units, and evaluating an expression with an exponent. The puzzle will motivate your students in 6th grade and up! Your PDF download includes:2-page digital version with horizontal layout, prepped for Easel 1-page printable version3 pages of Teacher Notes including step-by-step Solutions, optional Extensions (inc
Subjects:
Grades:
6th - 8th
Types:
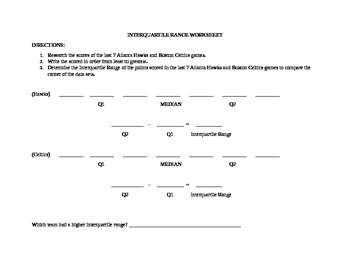
Get Sporty with Interquartile Ranges
Do you need help teaching your students about the "middle 50" in a data set? Introduce Interquartile Ranges in a fun and engaging way with this worksheet. Students will analyze the scores of the two teams and determine which has the best point spread. You can even customize the teams to feature your favorites! ♯ Please review TOU before purchasing.Be sure to look at the Preview and Thumbnails to ensure this activity aligns with your students/curriculum. If you have any questions, please contact
Subjects:
Grades:
5th - 8th
Types:
CCSS:
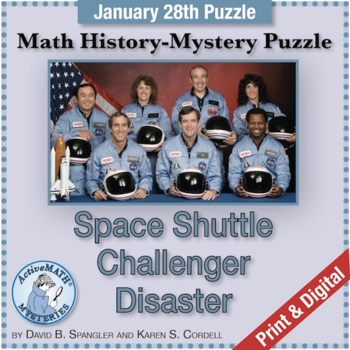
Jan. 28 Math & Science Puzzle: NASA Space Shuttle Challenger | Mixed Review
January 28 of the Mystery Year was the day of the Space Shuttle Challenger disaster. To find the year, student solve math clues involving percent of a number, converting a probability given as a fraction to a percent, and divisibility by 6 in a real-world context. This engaging puzzle is great for middle school students to use any time.Your PDF download includes:2-page digital version with horizontal layout, prepped for Easel 1-page printable version4 pages of Teacher Notes including step-by-ste
Subjects:
Grades:
6th - 8th
Types:
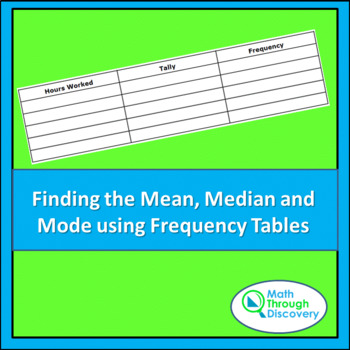
Alg 1 - Finding the Mean, Median and Mode Using Frequency Tables
This activity sheet contains four problems for students to create frequency tables and then calculate the median, mode, and mean. One of the activities has students generate data by rolling dice.
Subjects:
Grades:
7th - 9th
Types:
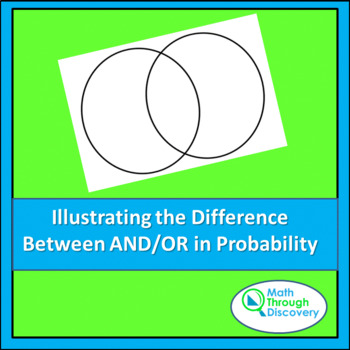
Alg 1 - Illustrating the Difference Between And/Or in Probability
This lesson can be used to help students understand the difference between the words “and” and “or” when used in probability statements.Examples are included and 6 additional problems for students to demonstrate their understanding.
Subjects:
Grades:
7th - 9th
Types:
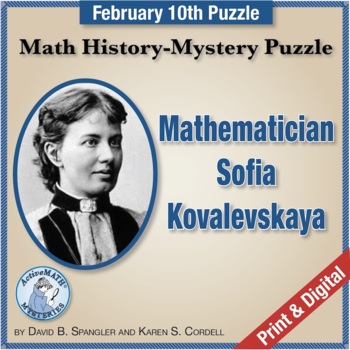
Feb. 10 Mathematician Puzzle: Sofia Kovalevskaya (Kowalevski) | Problem Solving
On February 10 of the Mystery Year, a famous mathematician passed away. The math clues for finding the year involve mean, solving a rational equation, acting out a non-routine problem, and finding the perimeter of a rectangle. The context of the puzzle relates to Russian mathematician Sofia Kovalevskaya. Your Zip download includes printable/digital PDFs:1-page printable Student Puzzle, also prepped for Easel1-page Answer Key with sample solutions1-page version of puzzle with expanding form field
Subjects:
Grades:
6th - 8th
Types:
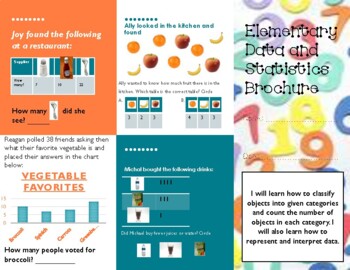
Lower Elementary Data and Statistics Brochure Activity (Data and Stat Standards)
This is a fun and interactive brochure activity RECOMMENDED For 1-3 grade. Use this activity in whole group, small group, independent math centers, homework, or as an assessment! This activity allows students to show their work in a unique and fun manner. This brochure follows data and statistic learning standards in grades 1-3. Students will learn how to classify objects into given categories and count the number of objects in each category. They will also learn how to represent and interpret d
Subjects:
Grades:
1st - 3rd
Types:
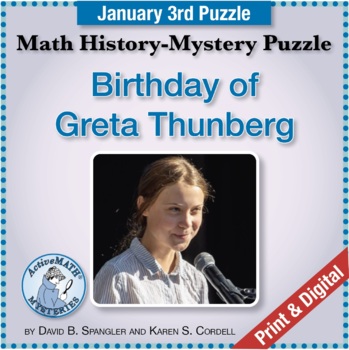
Jan. 3 Math & Science Puzzle: Greta Thunberg, Activist | Mixed Review
January 3 of the Mystery Year is the birthday of climate activist Greta Thunberg. This cross-curricular warm-up connects her work to math involving mean, evaluating expressions with powers of 10, and percent. This motivational puzzle is great for middle school or high school students to use any time. Your PDF download includes:2-page digital version with horizontal layout, prepped for Easel 1-page printable version3 pages of Teacher Notes including step-by-step Solutions, optional Extensions, an
Subjects:
Grades:
6th - 8th
Types:
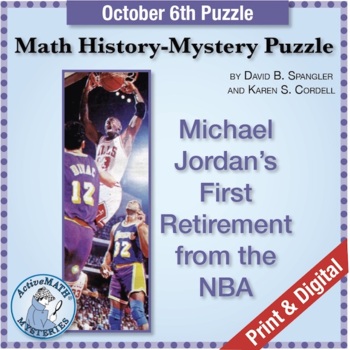
Oct. 6 Math & Sports Puzzle: Michael Jordan’s 1st NBA Retirement | Mixed Review
October 6 of the Mystery Year was the date or Michael Jordan's first retirement from the NBA. This cross-curricular warm-up activity provides engaging connections to Michael Jordan and sports data. As students in 6th grade and up solve math clues to find the year, they solve problems with box plots, the mean, and the range.Your PDF download includes:2-page digital version with horizontal layout, prepped for Easel 1-page printable version4 pages of Teacher Notes including step-by-step Solutions,
Subjects:
Grades:
6th - 8th
Types:
Showing 1-24 of 26 results


