38 results
Graphing lectures $5-10
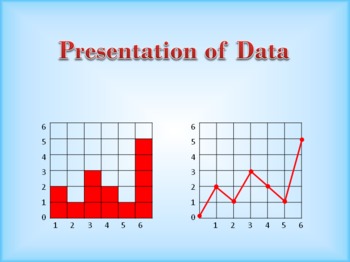
Tables, bar charts, and graphs - how to construct them in order to present data
By the time students reach middle school, they have learned how to fill in the data on a table, bar chart, and graph, but they still need to learn how to create (construct, make, or draw) one from scratch. This is a PowerPoint presentation, with lecture notes and associated worksheets, that demonstrates how to present data clearly, by constructing tables, bar charts, and graphs from raw data. It covers topics such as the relationship between independent and dependent information (variables), a m
Subjects:
Grades:
7th - 10th
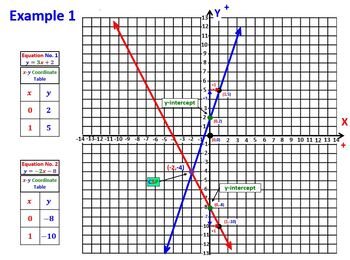
Math 1 Unit 3 Systems of Equations & Inequalities Lesson 1-5 Video/Wrksht Bundle
This bundle consists of the following five (5) Math 1 - Unit 3 Systems of Linear Equations and Inequalities Lesson Videos, Student Worksheets and Teacher Answer Keys:Lesson 1 - Solving Systems of Linear Equations by GraphingLesson 2 - Solving Systems of Linear Equations by SubstitutionLesson 3 - Solving Systems of Linear Equations by EliminationLesson 4 - Solving Systems of Linear Inequalities by GraphingLesson 5 - Solving Systems of Linear Equations and Inequalities Word ProblemsThis bundle inc
Subjects:
Grades:
8th - 11th
Types:
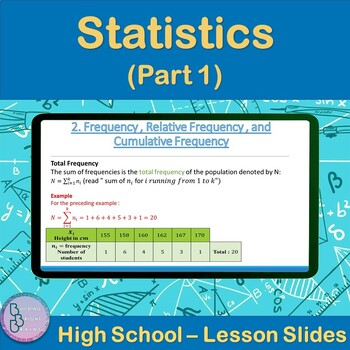
Statistics Part 1 | High School Math PowerPoint Lesson Slides
Are you teaching your High School students about Statistics? Plenty of examples and application exercises are included. You can also easily convert this to a Google Slides lesson by dragging it into your Google Drive.What is included?✦ 30 total slides for notes, examples and applications.✦ All steps are animated to allow the teacher to explain them gradually. Throughout the Lesson, students will be introduced to the following:✦ Statistics Vocabulary✦ Frequency , Relative Frequency , and Cumulati
Subjects:
Grades:
10th - 12th, Higher Education
Histograms and Frequency Tables (Powerpoint) for Busy Teachers
This powerpoint presentation introduces the concept of histograms and frequency tables.
Clipart, sounds, and animation are used sparingly and effectively to help illustrate points without being distracting. This powerpoint presentation has been extensively refined using faculty AND student input and feedback.
Definitions of histogram, interval, frequency table, and frequency are all presented. The progression from a frequency table to a completed histogram is illustrated and animated using
Subjects:
Grades:
4th - 12th, Higher Education, Adult Education
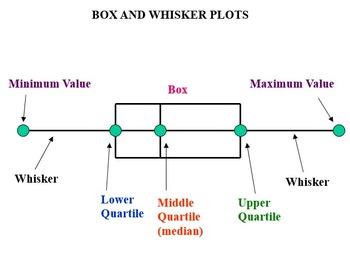
Graphing Galore! (PowerPoint presentation on data and graphing)
This is a PowerPoint presentation loaded with lots of graphing and data information. In this presentation students learn vocabulary, how to organize data, the difference between different types of graphs, how to set up different graphs, and there are examples for students to try on their own in order to check for understanding. This presentation includes the following information:
--Mean, Median, Mode, Range
--Outliers
--Line Plots
--Frequency Tables
--Relative Frequency
--Histograms
--Stem &a
Subjects:
Grades:
6th - 9th
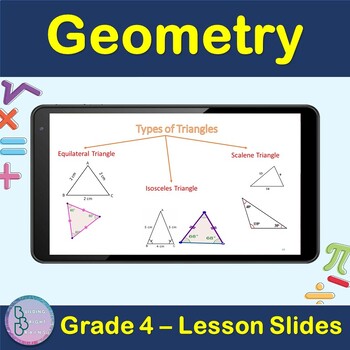
Geometry | 4th Grade PowerPoint Lesson Slides Line Circle polygon Triangle
Are you teaching your students about Geometry For 4th Grade? Plenty of examples and application exercises are included. You can also easily convert this to a Google Slides lesson by dragging it into your Google Drive.What is included?✦ 49 total slides for notes, examples and applications.✦ All steps are animated to allow the teacher to explain them gradually. At the end of the lesson, students will be able to Apply✦ Point, Line, Line segment✦ Angles, Parallel and perpendicular lines✦ Circles✦ po
Grades:
3rd - 5th
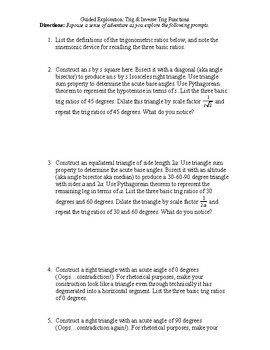
Guided Exploration: Trig & Inverse Trig Functions
35-item teacher-lead inquiry into properties and behavior of Trigonometric/Inverse Trigonometric Functions. Best used at the beginning of a unit on trigonometric/inverse trigonometric functions (before demonstrating how to solve textbook problems), this activity invites students to use inductive reasoning and class discussion to discover the big ideas behind graphing trigonometric/inverse trigonometric functions without a graphing utility.
Subjects:
Grades:
10th - 12th
Types:
CCSS:
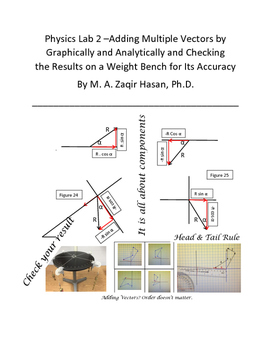
Physics Lab 2 - Adding Multiple Vectors by Graphical and Analytic Methods
The best lab you can do to teach your students how to add multiple vectors by graphical and analytic method. It shows the graphical method of adding vectors in step-by-step method starting from selecting the scale.
The graphical method is followed by the analytic method in great detail. An extensive discussion is available in breaking a vector in to two components perpendicular to each other. Students usually find it difficult to break a vector in its components.
Finally, the result is verified
Subjects:
Grades:
10th - 12th
Types:
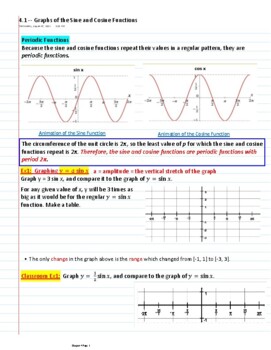
Ch4 Trigonometry - Pre calc - Graphing of the 6 Trig Functions - guided notes
Have guided notes done for you. Students can print the chapter ahead of time and therefore will spend less time having to write the questions and can focus on listening and doing the guided practice. The student and teacher will be more organized and have notes available to study. It is a win win! Having built in graphs is amazing for both teacher and student!answer key included of worked out problems There are free video lessons that go with every section of this chapter on my YouTube channel c
Subjects:
Grades:
9th - 12th
Types:
Algebra Power Point: Graphing Inequalities in Two Variables with GUIDED NOTES
With the greatest of enthusiasm, I share my most recent power point with you on "Graphing Inequalities in Two Variables".
* The lesson begins with a review showing ordered pairs as solutions to inequalities.
* Step by step, students move into graphing inequalities of vertical and horizontal lines.
* They review the meaning of boundaries, half-planes, and how to test for the solution half-plane.
* Progressing, they graph inequalities in two variables using slope-intercept
Subjects:
Grades:
7th - 12th, Higher Education, Adult Education
CCSS:
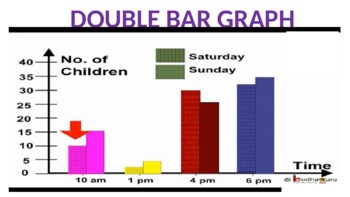
Double Bar Graph Powerpoint
The presentation contains:Learning Objectives.Definition of a double bar graph.Parts of a double bar graph.Difference between bar graph and double bar graph.Tips for construction of double bar graph.Steps to construct double bar graph with an example.To read and interpret the double bar graph.
Subjects:
Grades:
5th - 10th, Staff
Also included in: Data Representation Powerpoint
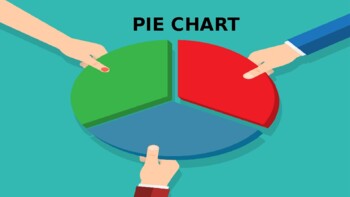
Pie Chart Powerpoint
The presentation contains:Learning Objectives.Definition of a Pie Chart.Tips for construction of pie chart.Steps to construct a pie chart with an example.Scaling and drawing a pie chart.Read and Interpret a pie chart.
Subjects:
Grades:
5th - 10th, Staff
Also included in: Data Representation Powerpoint
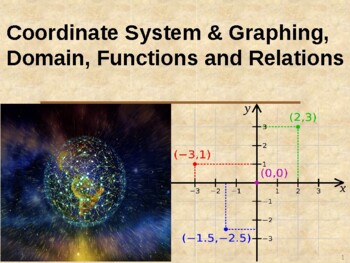
Coordinate Plane & Graphing Powerpoint/Lesson - Functions, Relations, Domain
This 103-slide lesson covers the coordinate plane, coordinates, quadrants, and how to plot points. It starts with a brief review of integers on the number line. It later covers the concepts of functions and relations and how to tell the difference. Domain and range are also included. There are many practice problems with step-by-step animation to show how problems are solved, and several review quizzes throughout.About 3-3.5 hours of material, best taught over 3-4 lessons.
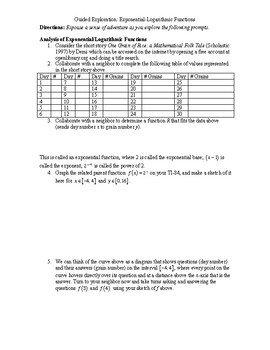
Guided Exploration: Exponential/Logarithmic Functions
63-item teacher-lead inquiry into properties and behavior of Exponential/Logarithmic Functions. Best used at the beginning of a unit on exponential/logarithmic functions (before demonstrating how to solve textbook problems), this activity invites students to use inductive reasoning and class discussion to discover the big ideas behind graphing exponential/logarithmic functions without a graphing utility.
Subjects:
Grades:
10th - 12th
Types:
CCSS:
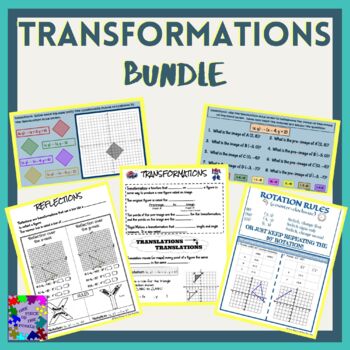
Transformations Bundle
This product provides a notetaking guides for:Translations Guided NotesReflections Guided NotesRotations Guided NotesIt also includes a practice activity:Translations Digital ActivityPrerequisites: Students should already know how to graph on the coordinate plane..Includes all of the linked resources above.This was designed to satisfy the common core standard:CCSS.HSG-CO.A.2CCSS.HSG-CO.A.3CCSS.HSG-CO.A.5Georgia Standard: MGSE9-12.CO.A.2, MGSE9-12.CO.A.3, MGSE9-12.CO.A.5
Grades:
8th - 10th
CCSS:
Line Graph Powerpoint
The presentation contains:Learning objectives.Definition of a line graph.Parts of a line graph.Tips for construction of line graph.Steps to construct line graph with an example.Reading and Interpreting a line graph.Advantage of line graph.
Subjects:
Grades:
5th - 10th, Staff
Also included in: Data Representation Powerpoint
Quadratics Unit guided notes Math 3 III
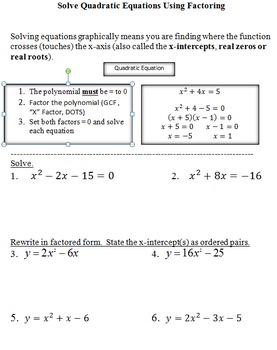
Guided Notes for a Quadratic Unit in Math III Common Core classroom.Includes...Solve Quadratic Equations Using FactoringUse Factoring to Solve Quadratic Word ProblemsSolve Quadratic Equations Using Quadratic FormulaSketching Quadratic Functions in Vertex FormConvert Vertex and Factored Forms of Quadratics Functions to Standard FormConvert Standard Form of a Quadratics Function to Vertex FormSketching Quadratic Functions in Standard FormComparing the 3 Different Forms of a Quadratic FunctionLots
Subjects:
Grades:
9th - 12th

Engage NY/Eureka Math Grade 6 Module 1 Lesson Pack
I have retyped and formatted all the student work pages from Engage NY/Eureka Math Grade 6 Module 1. This can be printed out in packet form or used digitally on a student device.
Subjects:
Grades:
6th
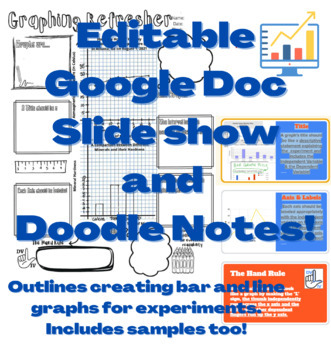
Scientific Graphing EDITABLE Google Slide Show with Keys and Doodle Note Sheet
This Slide Show does a wonderful job outlining key aspects of graphs including: Line and bar graphs, accurate titling, axis, and scaling. The doodle note sheet gives two examples of correct graphs, in addition to encouraging students creativity. It will help your students create their own graphs to represent their data in future experiments from start to finish.
Grades:
5th - 9th
Types:
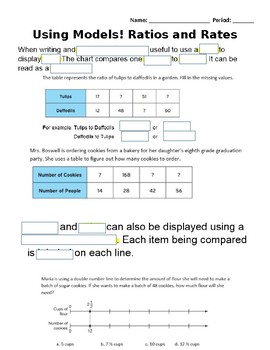
Using Models to Represent Ratios, Rates and Unit Rates Scaffold Notes
Students will use these fill in the blank notes to guide them through the Smartboard lesson on Models for ratios, rates and unit rates (located in store). Each page of the lesson is a screen shot with missing words. Students will fill in the blank and answer practice problems on handout. There is a lot an answer doc with the missing words filled in for any students with accommodations.
Subjects:
Grades:
5th - 7th
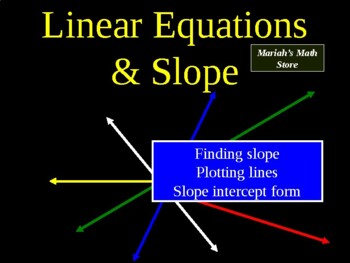
Lesson on Linear Equations, Slope, and Slope Intercept Form - Graphing
This 42- slide lesson/Powerpoint lecture on graphing with the coordinate plane includes slope, intercept, linear equations and other pre-algebra topics. It is highly animated, showing step-by-step how to perform calculations.Main topics include:Definition of line and linear equation with examplesIdentifying sign of slopeCalculating slopeSpecial cases - no slope and undefined slopeSlope-intercept form - what it is and how to write equations in this formThis would be appropriate for 6th grade or a
Grades:
5th - 7th
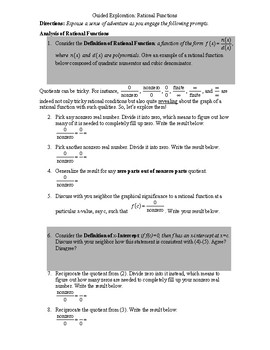
Guided Exploration: Rational Functions
47-item teacher-lead inquiry into properties and behavior of Rational Functions. Best used at the beginning of a unit on rational functions (before demonstrating how to solve textbook problems), this activity invites students to use inductive reasoning and class discussion to discover the big ideas behind graphing rational functions without a graphing utility.
Subjects:
Grades:
10th - 12th
Types:
CCSS:
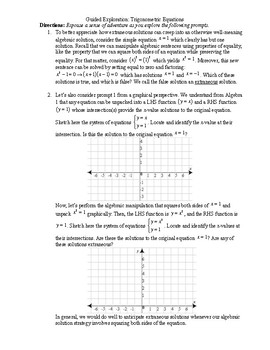
Guided Exploration: Trigonometric Equations
9-item teacher-lead inquiry into properties and behavior of Trigonometric Equations. Best used at the beginning of a unit on solving trigonometric equations (before demonstrating how to solve textbook problems), this activity invites students to use inductive reasoning and class discussion to discover the big ideas behind solving trigonometric equations without a graphing utility.
Subjects:
Grades:
10th - 12th
Types:
CCSS:
Computer Science in One Hour! Grades 5-8 Math or ELA! No experience needed!
Computer science and coding are what all the kids are talking about! This is a scripted, colorful lesson plan with activities for students! Absolutely no computer science or technology experience necessary! Your students will be fully engaged. This lesson shows a step-by-step guide to basic computer science concepts, which will lead your students to writing actual code within the first 10 minutes! This lesson may be adapted in either an English/language arts class or a math class grades 5-8
Subjects:
Grades:
5th - 8th
Types:
Showing 1-24 of 38 results


