36 results
Free graphing lectures

Notes - Introduction to Inequalities
These are notes used to introduce students to inequalities. Students will represent inequalities graphically (on a number line), translate an inequality in words to an inequality using symbols and graph, state whether a number is in the solution set of an inequality and write and graph inequalities that represent real-life situations.
Grades:
5th - 8th
Types:
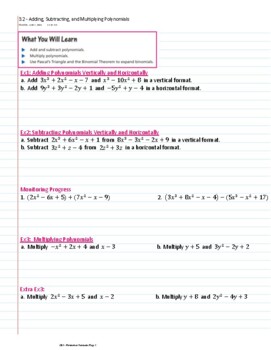
3.2 - Adding, Subtracting, and Multiplying Polynomials Guided Notes
These are guided notes for Adding, Subtracting, and Multiplying Polynomials.https://www.youtube.com/channel/UCkIKDr88dVyIue_n8ZzOCeA/playlists I have made video lesson for the entire year of Integrated math 3 (algebra 2) and trig and will be making my guided notes available here. My YouTube channel is called "Janice Parks" and the videos a FREE to use.
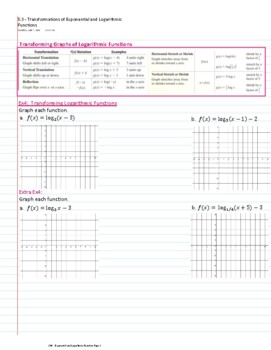
Transformations of Exponential and Logarithmic Functions - guided notes (5.3)
transformations of exponential and log functions - guided notesThere is a free video lessons to go along with these guided notes on my YouTube channel called "Janice Parks".https://www.youtube.com/channel/UCkIKDr88dVyIue_n8ZzOCeA/playlists

Writing Linear Equations Plus Graphing | PowerPoint with Guided Notes
This is a unique PowerPoint presentation for Middle School Math, Algebra 1, Algebra 2, or PreCalculus that includes 4 examples on writing linear equations with point-slope form and slope-intercept form. Each example includes a graph as well! A PDF for fill-in notes is also included! Each step is set to show up on click, so you are able to walk around and monitor the students during the lesson and they can't get ahead of you!
Subjects:
Grades:
6th - 12th
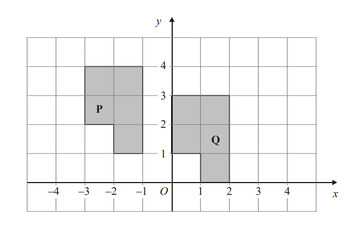
Midpoint of a Line, Translation and Reflection of 2D Shapes. PPT File
This is a power point presentation that covers the topic midpoint of a line segment, the coordinate of a point that lies a fraction of a line segment. Translation of 2D shapes with examples that cover performing the translation and describing the translation.Reflection of 2D shapes with examples that cover performing the reflection and describing the reflection.

Practice Solving Inequalities Notes
This notes page will allow students to practice solving and graphing inequalities in one variable. Students will solve a variety of inequalities including those in which they must flip the inequality sign. They will also review important skills such as distributing, combining like terms and multiplying by the reciprocal to eliminate a fractional coefficient.
Grades:
5th - 9th
Types:
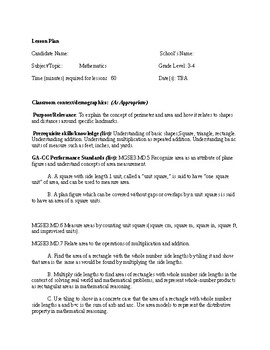
Lesson Plan for area and perimeter 4th grade
A detailed lesson plan covering:
MGSE3.MD.5 Recognize area as an attribute of plane figures and understand concepts of area measurement.
A.A square with side length 1 unit, called a “unit square,” is said to have “one square unit” of area, and can be used to measure area.
B.A plan figure which can be covered without gaps or overlaps by n unit squares is said to have an area of n square units.
MGSE3.MD.6 Measure areas by counting unit squares(square cm, square m, square in, square ft, and improv
Subjects:
Grades:
4th
Types:

How to Make a Graph
Each PowerPoint slide shows steps on how to make a Pictograph (Picture graph), a Bar Graph, and then a Line Plot.
Grades:
2nd - 5th
Graphing Inequalities on the Number Line
Graphing one variable inequalities using a number line
Subjects:
Grades:
4th - 12th, Higher Education, Adult Education
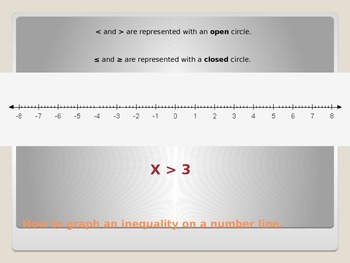
Graphing Inequalities on a Number Line
Teaches students how to use open and closed circles. Reviews <,>, ≥, ≤.
Interactive PowerPoint. Compatible with Smart boards.
Subjects:
Grades:
6th - 12th
Types:
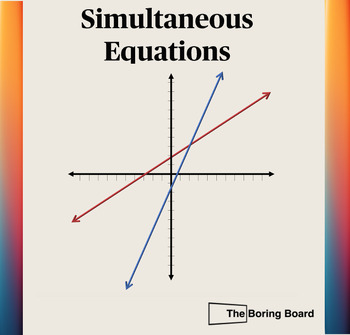
Animated Lesson, Simultaneous Equations
Animated Chapter Set: Simultaneous EquationsProduct Overview:Welcome to the world of elite teaching tools.Break down the complexity simultaneous equations with this dynamic animated chapter set. Let's elevate your teaching game. To view animation: Use Slides Show button.View -> Slide showKey Features:The Grand Entrance - Introduction: Stop boring them to tears. Kick things off with an introduction that doesn’t just talk – it SHOWS. Graphical Solution - No More Guesswork: Show them precisely h
Subjects:
Grades:
8th - 10th
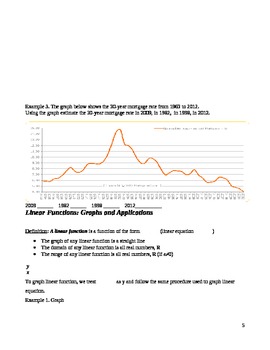
Graphs and function notation
The lecture includes topics: graphs of line, function notation. It can be used as review or as a lesson to introduce function notation. The examples are practical and last one is real life application of using graphs and functions. In general, it gives overview of graphs and functions as special kind of relations.
In case students are confused how to determine is relation a function or not, I suggest the following approach.
Let consider each element of domain represent a child and each element
Subjects:
Grades:
9th - 12th, Higher Education
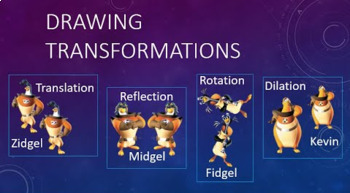
Drawing Transformations: Video with Notes -Distance Learning
For students to learn how to draw transformations (translations, reflections, rotations, and dilations) on a graph, they can watch the 12 minute YouTube video lesson. They can print out and fill in the attached note page with blanks. (8th grade or HS Geometry)This could work for students who were absent, or are learning from home.The video link is: https://youtu.be/kviVkGAfefoThe PowerPoint is available on TpT.
Explaining Domain and Range with graphs
This powerpoint uses dynamic graphing to illustrate domains and ranges of functions. Clear visuals and multiple examples will help the learners new to the concepts as well as those who have been having difficulty understanding the concept. Student examples and solutions are supplied at the end of the powerpoint and are in the same format as practice sets.
Domain and Range by Dr. Barbara Smith is licensed under a Creative Commons Attribution-NonCommercial 4.0 International License.
Subjects:
Grades:
9th - 12th
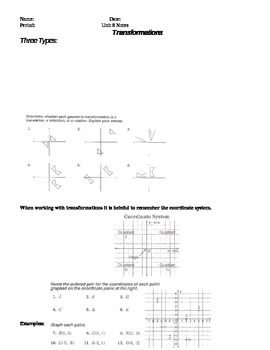
Transformations Student Notes page
Here is the handout I give my students for my transformations unit. It is a fill in the blank handout that students actively participate with during notes in class.
There is a power point that I have created to go along with this handout that is for sale for $3.00.
Kids typically enjoy this unit because there are a LOT of examples and pictures that they get a kick out of.
Enjoy :)
Subjects:
Grades:
6th - 10th
Types:
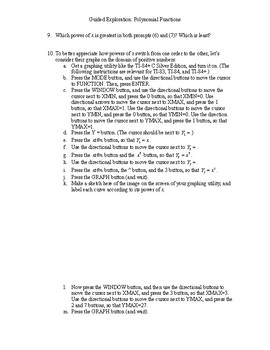
Guided Exploration: Polynomial Functions
42-item teacher-lead inquiry into properties and behavior of Polynomial Functions. Best used at the beginning of a unit on polynomial functions (before demonstrating how to solve textbook problems), this activity invites students to use inductive reasoning and class discussion to discover the big ideas behind graphing polynomial functions without a graphing utility.
Subjects:
Grades:
10th - 12th
Types:
CCSS:
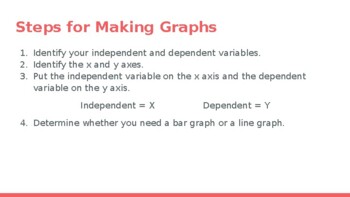
Bar Graphs vs Line Graphs
This is a short interactive lecture to help students learn whether they need a bar graph or a line graph. After introducing the idea that bar graphs are for categorical data and line graphs are for numerical data, students are shown different types of data and decide whether the data warrants a bar graph or a line graph.
Grades:
7th - 12th
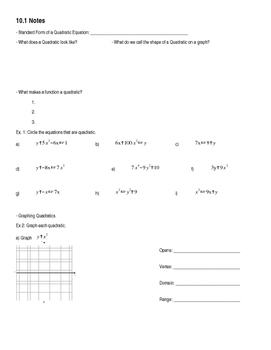
Quadratics Note Packet
This is an editable note note packet (in Word) that covers what a quadratic equation is, graphing quadratics using various methods, finding zeroes from a graph, and solving quadratic equations using the quadratic formula and square roots.
Subjects:
Grades:
8th - 11th
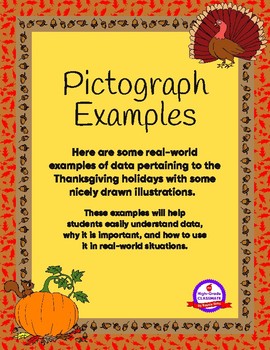
Pictograph Examples - Thanksgiving Edition
Here are some real-world examples of data pertaining to the Thanksgiving holidays with some nicely drawn illustrations.These examples will help students easily understand data, why it is important, and how to use it in real-world situations.Package Includes:-1 Pictograph of: Turkeys Bought Last Year from the Local Turkey Farm-1 Pictograph of: Pumpkins Harvested Last Year from Old McGrover's Farm-2 Pictographs of: Corn Shucked and Eaten in a Day (no relation)-2 Pictographs of: Pumpkin Pie Sales a
Subjects:
Grades:
3rd - 6th
Types:

Linear Function Power Point
Power Point designed for linear function in Algebra I Honors includes: "bellringer," Mr. Slope Guy, x and y intercepts, graphing, rate of change, slope and "real-world" examples. Designed for a 50 minute lectures and involves student interaction.
Subjects:
Grades:
8th - 10th
CCSS:
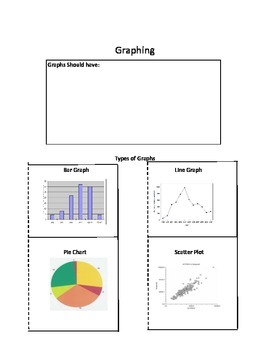
Types of Graphs Interactive Notebook page
This is a page for an interactive notebook. It includes flaps for four types of graphs: bar, line, pie, and scatter plot.
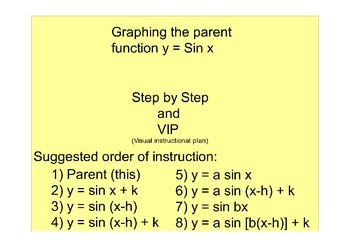
Graphing the parent function y = sin x
A step by step rational to arrive at the correct graph.
Prerequisite: Students must understand the relationship between any point on the unit circle and the angle whose terminal ray intercepts it. (cosine theta, sine theta).
A VIP (visual instructional plan) pioneered by Fred Jones is included for use during guided instruction.
Subjects:
Grades:
10th - 12th
Types:
CCSS:

Electronic Student Grapher
The electronic student grapher is a simple program that can be used to demonstrate graphing linear lines and inequalities. This also can be used to allow students explore and demonstrate their ability to create graphs.
Subjects:
Grades:
7th - 12th
Types:
Pictograph Example - Thanksgiving Edition - FREE
Here is a real-world example of data pertaining to the Thanksgiving holidays with some nicely drawn illustrations.This example will help students easily understand data, why it is important, and how to use it in real-world situations.Package Includes:-1 Pictograph of: Turkeys Bought Last Year from the Local Turkey FarmThis slide is great for showing students the data on an overhead projector and discussing how the data changes throughout the year for specific reasons.Click “FOLLOW ME” if you lik
Subjects:
Grades:
3rd - 6th
Types:
Showing 1-24 of 36 results


