65 results
Elementary graphing lectures for staff and administrators
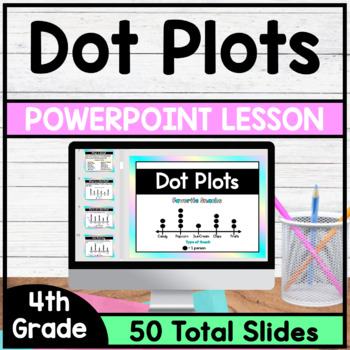
Dot Plots - PowerPoint Lesson
This is a PowerPoint Lesson that focuses on Dot Plots. This PowerPoint Lesson goes through the complete lesson plan cycle. In this lesson students will learn about the parts of a dot plot and will understand how to summarize data on a dot plot. *This PowerPoint Lesson has everything you need to teach a lesson. Just download and begin teaching. This lesson includes Direct Instruction Slides, Guided Practice Slides and Independent Practice Slides. (Printable Version of Guided Practice Questions
Grades:
4th
CCSS:
Also included in: 4th Grade Math PowerPoint Lessons - Bundle
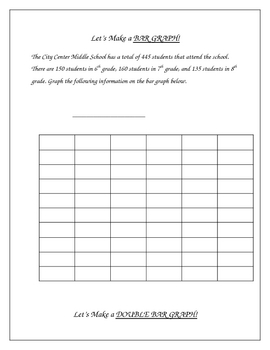
Constructing Graphs - Bar Graphs, Line Graphs, Circle Graphs
**I revised the numbers in the pie graph on this from the first version, these amounts are much more friendly** This activity includes construction of a bar graph, double bar graph, line graph, double line graph, and a circle graph.I put this together after being frustrated about not being able to find any graphing activities appropriate for intermediate grades that would allow me to make graphs with the class on my smartboard. I needed some examples to demonstrate how to take data and create a
Subjects:
Grades:
3rd - 10th, Adult Education
Types:
Histograms and Frequency Tables (Powerpoint) for Busy Teachers
This powerpoint presentation introduces the concept of histograms and frequency tables.
Clipart, sounds, and animation are used sparingly and effectively to help illustrate points without being distracting. This powerpoint presentation has been extensively refined using faculty AND student input and feedback.
Definitions of histogram, interval, frequency table, and frequency are all presented. The progression from a frequency table to a completed histogram is illustrated and animated using
Subjects:
Grades:
4th - 12th, Higher Education, Adult Education
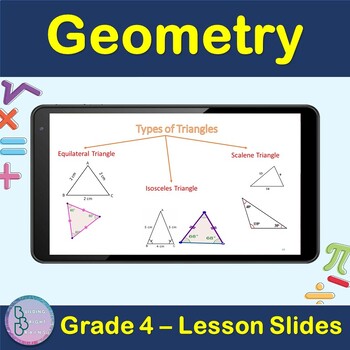
Geometry | 4th Grade PowerPoint Lesson Slides Line Circle polygon Triangle
Are you teaching your students about Geometry For 4th Grade? Plenty of examples and application exercises are included. You can also easily convert this to a Google Slides lesson by dragging it into your Google Drive.What is included?✦ 49 total slides for notes, examples and applications.✦ All steps are animated to allow the teacher to explain them gradually. At the end of the lesson, students will be able to Apply✦ Point, Line, Line segment✦ Angles, Parallel and perpendicular lines✦ Circles✦ po
Grades:
3rd - 5th
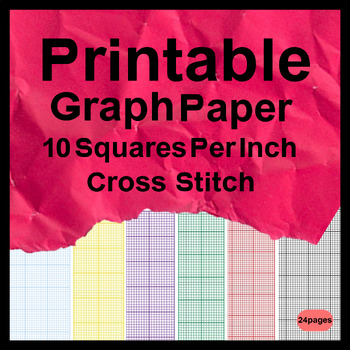
Printable Graph Paper 10 Squares Per Inch Cross Stitch
Printable Graph Paper 10 Squares Per Inch Cross Stitch - Grid paper is essentially the type of paper most commonly used for drawing and sketching purposes. It is widely used for making plan charts, designing websites, developing home ideas and so forth. A great deal of businesses who need to produce a company card, business brochures, catalogues, brochures, and so forth need this kind of graph paper.
Subjects:
Grades:
5th - 12th
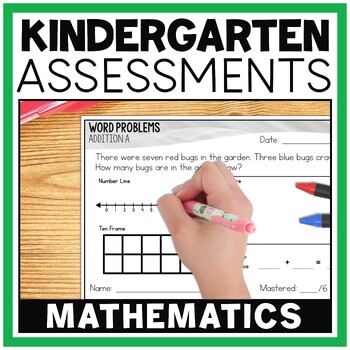
Kindergarten Math Assessments for the Year
Quality kindergarten math assessments are a must-have for your classroom! Throughout the year you will constantly be assessing your students. If you are looking for a quick and simple way to manage this task, Rapid Results half-page kindergarten math assessments are perfect for you! The kindergarten math assessments were developed to provide you with an easy way to test your students on concepts they are required to learn.How many assessments are included?There are 185 math assessments in your d
Subjects:
Grades:
K
Also included in: Kindergarten Beginning of the Year Assessments for Math and Literacy

Notes - Introduction to Inequalities
These are notes used to introduce students to inequalities. Students will represent inequalities graphically (on a number line), translate an inequality in words to an inequality using symbols and graph, state whether a number is in the solution set of an inequality and write and graph inequalities that represent real-life situations.
Grades:
5th - 8th
Types:
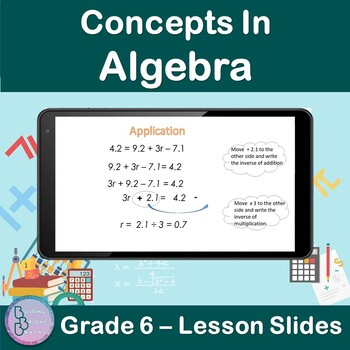
Concepts in Algebra | 6th Grade PowerPoint Lesson Slides | Algebraic Patterns
Are you teaching your students about Concepts In Algebra For 6th Grade? Plenty of examples and application exercises are included. You can also easily convert this to a Google Slides lesson by dragging it into your Google Drive.What is included?✦ 47 total slides for notes, examples and applications.✦ All steps are animated to allow the teacher to explain them gradually. At the end of the lesson, students will be able to✦ Solve Algebraic Patterns ✦ Solve Two-Step Equations✦ Solve Addition and Sub
Grades:
5th - 7th
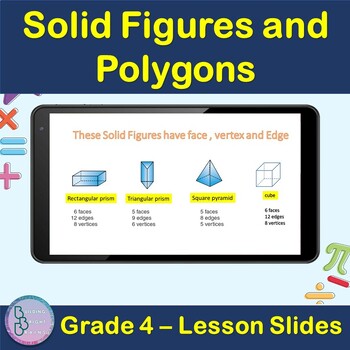
Solid Figures and Polygons | 4th Grade PowerPoint Lesson Slides
Are you teaching your students about Solid Figures and Polygons For 4th Grade? Plenty of examples and application exercises are included. You can also easily convert this to a Google Slides lesson by dragging it into your Google Drive.What is included?✦ 11 total slides for notes, examples and applications.✦ All steps are animated to allow the teacher to explain them gradually. At the end of the lesson, students will be able to ✦ Define Polygons✦ Define Solid figures✦ Understand Solid figures Fac
Grades:
3rd - 5th
Data Representation Powerpoint
The presentation contains: 1) TALLY MARKS Learning Objectives. Definition of a tally mark. Uses of tally mark. How to count a tally mark. Tally Mark Chart. Construction of a tally mark table with an example. Application on real life problems on tally mark. Read and Interpret a tally mark table.The presentation contains: 2) FREQUENCY DISTRIBUTION TABLEDefinition of a Frequency Distribution Table. Types of Frequency Distribution Table: a) Discrete Frequency Distribution Table (Ungrouped).b) C
Subjects:
Grades:
1st - 10th, Higher Education, Staff
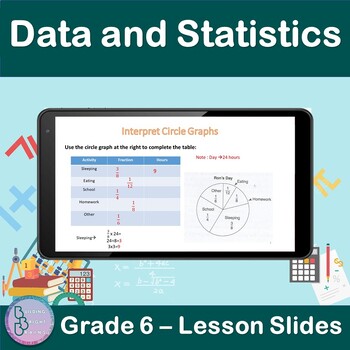
Data and Statistics | 6th Grade PowerPoint Lesson Slides | Circle Graphs
Are you teaching your students about Data and Statistics For 6th Grade? Plenty of examples and application exercises are included. You can also easily convert this to a Google Slides lesson by dragging it into your Google Drive.What is included?✦ 9 total slides for notes, examples and applications.✦ All steps are animated to allow the teacher to explain them gradually. At the end of the lesson, students will be able to✦ Interpret Circle Graphs.✦ Use a circle graph to complete s table.✦ Use a cir
Subjects:
Grades:
5th - 7th
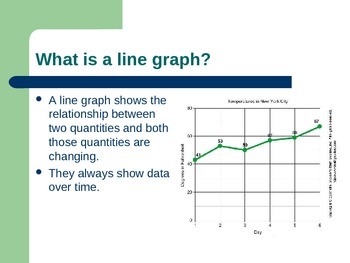
Graphing Powerpoint
This is an introductory PowerPoint graphing. The PowerPoint includes:
-Different types of graphs
-Vocabulary used to construct a graph
-How to construct a line graph
Notes of formatted is such a way that they can easily be used in A.V.I.D. Cornell Note style with the heading being used as the question in the left column and the notes for the right column.
Subjects:
Grades:
5th - 7th

3rd Grade - Skill Support Resource Packet
This large resource is a 382 page packet of skills with solutions for additional skill practice.A Table of Contents is supplied to provide easy reference to skill pages. Instant downloading of skills for immediate use in the classroom.It contains almost all the skills for the 3rd grade with multiple versions on specific skills regardless of state standards (i.e. place value - complete, coins, clocks, computational skills, number line/domino models, geometry - 2D/3D, fractions, computational pi
Subjects:
Grades:
3rd
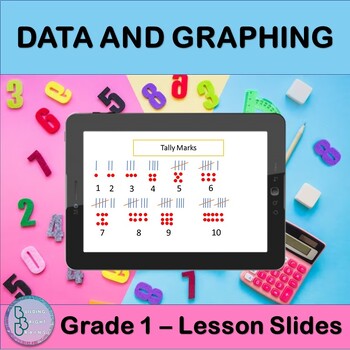
Data and Graphing | PowerPoint Lesson Slides Tally Chart Pictograph Bar Graph
Are you teaching your students about Data and Graphing? This resource is great for you for First Grade! Plenty of examples and application exercises are included. You can also easily convert this to a Google Slides lesson by dragging it into your Google Drive.What is included?✦ 6 total slides for notes, examples and applications.✦ All steps are animated to allow the teacher to explain them gradually. At the end of the lesson, students will be able to ✦ Make a Tally Chart✦ Make a Pictograph✦ Read
Grades:
1st - 2nd
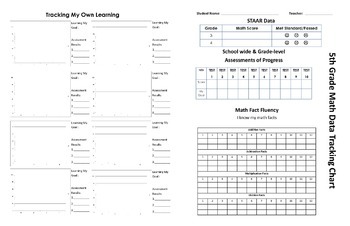
5th Grade STAAR Student Goal Setting & Assessment Tracker
Students and Teachers can learn a lot about their own thinking and learning by goal setting and tracking their progress.
These 11x17 goal setting and data tracking folders not only serve as a way to intrinsically motivate your students, but also allows you to guide students to setting those goals.
Students can goal set, track tests/assessments, math fact fluency to help them become aware of their strengths and weaknesses.
Subjects:
Grades:
5th
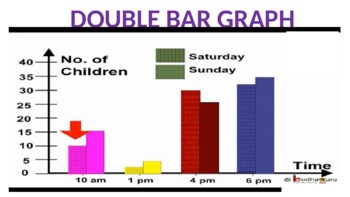
Double Bar Graph Powerpoint
The presentation contains:Learning Objectives.Definition of a double bar graph.Parts of a double bar graph.Difference between bar graph and double bar graph.Tips for construction of double bar graph.Steps to construct double bar graph with an example.To read and interpret the double bar graph.
Subjects:
Grades:
5th - 10th, Staff
Also included in: Data Representation Powerpoint
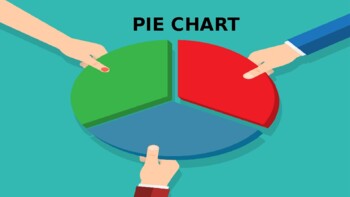
Pie Chart Powerpoint
The presentation contains:Learning Objectives.Definition of a Pie Chart.Tips for construction of pie chart.Steps to construct a pie chart with an example.Scaling and drawing a pie chart.Read and Interpret a pie chart.
Subjects:
Grades:
5th - 10th, Staff
Also included in: Data Representation Powerpoint
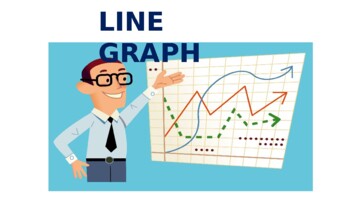
Line Graph Powerpoint
The presentation contains:Learning objectives.Definition of a line graph.Parts of a line graph.Tips for construction of line graph.Steps to construct line graph with an example.Reading and Interpreting a line graph.Advantage of line graph.
Subjects:
Grades:
5th - 10th, Staff
Also included in: Data Representation Powerpoint
Math Review Fifth Grade & Level Up to Sixth Grade
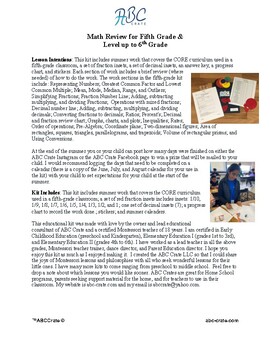
This kit includes summer work that covers the CORE curriculum used in a fifth grade classroom, a set of fraction insets to cut out, a set of decimal insets to cut out, an answer key, and a progress chart. Each section of work includes a brief review (where needed) of how to do the work. The work sections in the fifth grade kit include: Representing Numbers; Greatest Common Factor and Lowest Common Multiple; Mean, Mode, Median, Range, and Outliers; Simplifying Fractions; Fraction Number Line; Add
Subjects:
Grades:
5th - 6th
Graphing Linear Equations (focus on Real-Life Situations)
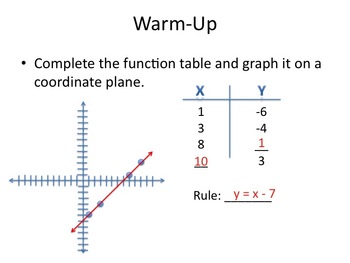
This PowerPoint can be used to introduce students to graphing linear equations. It should be played as a slideshow, where it steps students through linear equations by starting with the basic idea of graphing a function. The presentation ramps up to focusing on real-life situations that might be represented by a function. The show ends by looking at different graphs and asking students to think of a real-world situation that might match the given graph.
Grades:
5th - 8th
CCSS:
Scientific Graphing EDITABLE Google Slide Show with Keys and Doodle Note Sheet
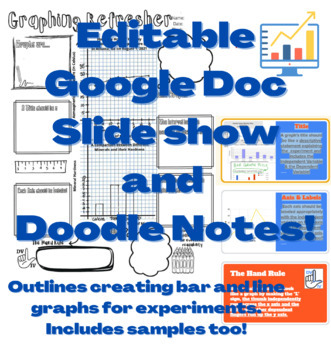
This Slide Show does a wonderful job outlining key aspects of graphs including: Line and bar graphs, accurate titling, axis, and scaling. The doodle note sheet gives two examples of correct graphs, in addition to encouraging students creativity. It will help your students create their own graphs to represent their data in future experiments from start to finish.
Grades:
5th - 9th
Types:
Graphical Representation of Data Powerpoint
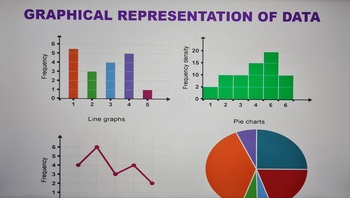
The presentation contains the follows:1) BAR GRAPH Learning objectives. Definition of a bar graph. Parts of a bar graph. Tips for construction of bar graph. Steps to construct bar graph with an example. Types of bar graph. Advantages of bar graph. 2) DOUBLE BAR GRAPH Learning Objectives. Definition of a double bar graph. Parts of a double bar graph. Difference between bar graph and double bar graph. Tips for construction of double bar graph. Steps to construct double bar graph wit
Subjects:
Grades:
5th - 9th, Staff
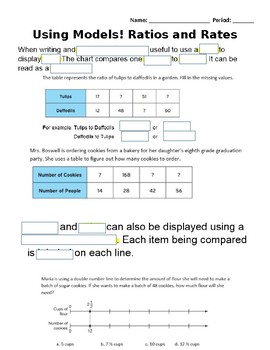
Using Models to Represent Ratios, Rates and Unit Rates Scaffold Notes
Students will use these fill in the blank notes to guide them through the Smartboard lesson on Models for ratios, rates and unit rates (located in store). Each page of the lesson is a screen shot with missing words. Students will fill in the blank and answer practice problems on handout. There is a lot an answer doc with the missing words filled in for any students with accommodations.
Subjects:
Grades:
5th - 7th
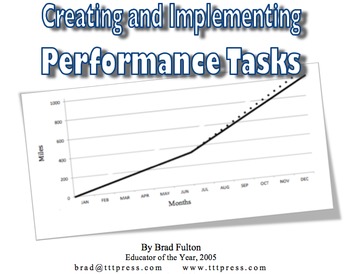
Creating and Implementing Common Core Math Performance Tasks
Performance tasks are designed not only to demonstrate a student’s proficiency with mastery of math content, they also give us an indication of how he or she is using the eight mathematical practices.
How we effectively implement these tasks is critical to our success as math teachers. Finding and creating performance tasks can be easy using these simple guidelines.
Two performance tasks are included as examples with ideas for assessment as well.
Subjects:
Grades:
5th - 9th
Showing 1-24 of 65 results


