83 results
Elementary graphing lectures for early intervention
Frog Street Press 2020 | COMPLETE SET | Lesson Slides, Themes 1-9
Frog Street Press Lesson Slides for Themes 1-9. These slides take the entirety of your teaching manual and condenses it into easy-to-follow, guided slides. Everything you need for the day's lesson is all in one place with links to additional resources.What's included:Table of Contents Slide (to navigate through the week)Greeting Circle w/ Brain Smart StartMorning MessageMusic & MovementRead-Aloud #1 and #2Practice Center Assignment (optional)Literacy & Math Small Group InstructionClosing
Grades:
PreK
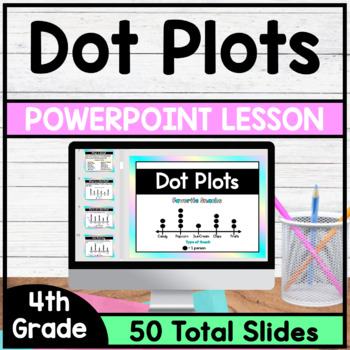
Dot Plots - PowerPoint Lesson
This is a PowerPoint Lesson that focuses on Dot Plots. This PowerPoint Lesson goes through the complete lesson plan cycle. In this lesson students will learn about the parts of a dot plot and will understand how to summarize data on a dot plot. *This PowerPoint Lesson has everything you need to teach a lesson. Just download and begin teaching. This lesson includes Direct Instruction Slides, Guided Practice Slides and Independent Practice Slides. (Printable Version of Guided Practice Questions
Grades:
4th
CCSS:
Also included in: 4th Grade Math PowerPoint Lessons - Bundle

Constructing Graphs - Bar Graphs, Line Graphs, Circle Graphs
**I revised the numbers in the pie graph on this from the first version, these amounts are much more friendly** This activity includes construction of a bar graph, double bar graph, line graph, double line graph, and a circle graph.I put this together after being frustrated about not being able to find any graphing activities appropriate for intermediate grades that would allow me to make graphs with the class on my smartboard. I needed some examples to demonstrate how to take data and create a
Subjects:
Grades:
3rd - 10th, Adult Education
Types:
Histograms and Frequency Tables (Powerpoint) for Busy Teachers
This powerpoint presentation introduces the concept of histograms and frequency tables.
Clipart, sounds, and animation are used sparingly and effectively to help illustrate points without being distracting. This powerpoint presentation has been extensively refined using faculty AND student input and feedback.
Definitions of histogram, interval, frequency table, and frequency are all presented. The progression from a frequency table to a completed histogram is illustrated and animated using
Subjects:
Grades:
4th - 12th, Higher Education, Adult Education
Frog Street Press 2020 | Lesson Slides | Changes, Week 2
Frog Street Press Lesson Slides for Theme 9, Week 2. These slides take the entirety of your teaching manual and condenses it into easy-to-follow, guided slides. Everything you need for the day's lesson is all in one place with links to additional resources.What's included:Table of Contents Slide (to navigate through the week)Greeting Circle w/ Brain Smart StartMorning MessageMusic & MovementRead-Aloud #1 and #2Practice Center Assignment (optional)Literacy & Math Small Group InstructionCl
Grades:
PreK
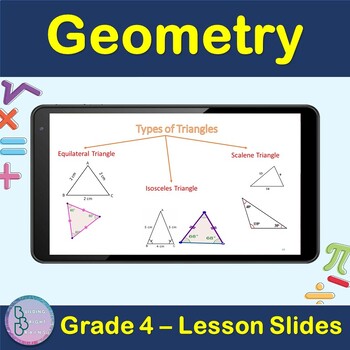
Geometry | 4th Grade PowerPoint Lesson Slides Line Circle polygon Triangle
Are you teaching your students about Geometry For 4th Grade? Plenty of examples and application exercises are included. You can also easily convert this to a Google Slides lesson by dragging it into your Google Drive.What is included?✦ 49 total slides for notes, examples and applications.✦ All steps are animated to allow the teacher to explain them gradually. At the end of the lesson, students will be able to Apply✦ Point, Line, Line segment✦ Angles, Parallel and perpendicular lines✦ Circles✦ po
Grades:
3rd - 5th

Personal Safety: Fire Safety PowerPoint
This is a PowerPoint slideshow that discuss important fire safety issues including the most common causes of fire, using water vs. a fire extinguisher, smoke detectors and things a person should do in case of a fire. The last part of the discussion includes a slide where students will assess their own home and how to exit in case of a fire. It provides situational awareness for students and instills a relevant situation because it refers to their own home. The PowerPoint includes questions that
Subjects:
Grades:
4th - 10th

Notes - Introduction to Inequalities
These are notes used to introduce students to inequalities. Students will represent inequalities graphically (on a number line), translate an inequality in words to an inequality using symbols and graph, state whether a number is in the solution set of an inequality and write and graph inequalities that represent real-life situations.
Grades:
5th - 8th
Types:
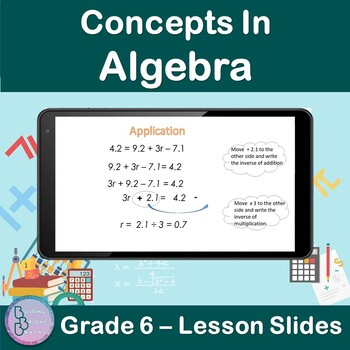
Concepts in Algebra | 6th Grade PowerPoint Lesson Slides | Algebraic Patterns
Are you teaching your students about Concepts In Algebra For 6th Grade? Plenty of examples and application exercises are included. You can also easily convert this to a Google Slides lesson by dragging it into your Google Drive.What is included?✦ 47 total slides for notes, examples and applications.✦ All steps are animated to allow the teacher to explain them gradually. At the end of the lesson, students will be able to✦ Solve Algebraic Patterns ✦ Solve Two-Step Equations✦ Solve Addition and Sub
Grades:
5th - 7th
Cognitive Distortions Lesson / Anxiety Mini-Unit / Slides+Activity / SEL
Use these detailed slides, note-taking organizer, and matching-style review activity to teach your audience about the 12 most common cognitive distortions! This will help students get a handle on their anxiety and increase their social emotional health. This lesson helps students become more anxiety-literate. Teachers can use this to bring some SEL into their regular-ed classroom, when teaching advisory, or with special populations. This can be used to supplement Second Step. This can also be us
Grades:
5th - 12th, Higher Education, Adult Education, Staff
Types:
Also included in: Social Emotional Learning (SEL) Mini-Unit Bundle

Developing a Fine Motor Program for Classroom or Therapy
Developing a Fine Motor Program for Classroom or Therapy - Article by Jan McCleskey, MA, OTRThis is an article for teachers or for occupational therapists, to teach how to develop a program for classroom or therapy for fine motor skills. Perfect for a training inservice for staff. Contents of training article:• Developmental fine motor skills (preschool – 1st grade)• Typical and atypical grasp patterns• Research on development of grasp patterns• TIP grip protocol for developing grasp• Coloring
Grades:
PreK - 1st, Staff
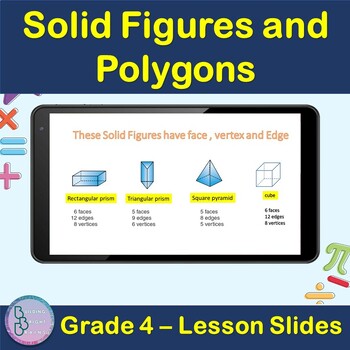
Solid Figures and Polygons | 4th Grade PowerPoint Lesson Slides
Are you teaching your students about Solid Figures and Polygons For 4th Grade? Plenty of examples and application exercises are included. You can also easily convert this to a Google Slides lesson by dragging it into your Google Drive.What is included?✦ 11 total slides for notes, examples and applications.✦ All steps are animated to allow the teacher to explain them gradually. At the end of the lesson, students will be able to ✦ Define Polygons✦ Define Solid figures✦ Understand Solid figures Fac
Grades:
3rd - 5th
Data Representation Powerpoint
The presentation contains: 1) TALLY MARKS Learning Objectives. Definition of a tally mark. Uses of tally mark. How to count a tally mark. Tally Mark Chart. Construction of a tally mark table with an example. Application on real life problems on tally mark. Read and Interpret a tally mark table.The presentation contains: 2) FREQUENCY DISTRIBUTION TABLEDefinition of a Frequency Distribution Table. Types of Frequency Distribution Table: a) Discrete Frequency Distribution Table (Ungrouped).b) C
Subjects:
Grades:
1st - 10th, Higher Education, Staff
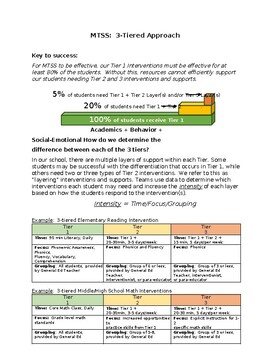
Key Features & components of Tiers 1, 2, & 3 Intervention and FAQ about Tier 3
This resource covers MTSS:3-Tiered Approach:-How do we determine the difference between each of the 3 tiers? Core Instruction–“Tier 1 Intervention” Supplemental Instruction–“Tier 2 Intervention” Intensive/Individualized Instruction–“Tier 3 Intervention”Here is an example:If the water in the aquarium is dirty, it makes little sense to single out struggling fish for corrective treatment. The first corrective treatment that should be applied is: clean the water in the aquarium; all the fish will
Grades:
K - 12th, Staff
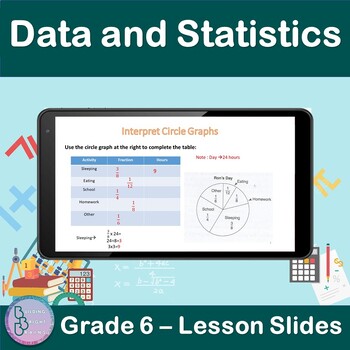
Data and Statistics | 6th Grade PowerPoint Lesson Slides | Circle Graphs
Are you teaching your students about Data and Statistics For 6th Grade? Plenty of examples and application exercises are included. You can also easily convert this to a Google Slides lesson by dragging it into your Google Drive.What is included?✦ 9 total slides for notes, examples and applications.✦ All steps are animated to allow the teacher to explain them gradually. At the end of the lesson, students will be able to✦ Interpret Circle Graphs.✦ Use a circle graph to complete s table.✦ Use a cir
Subjects:
Grades:
5th - 7th
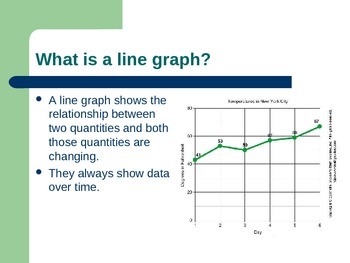
Graphing Powerpoint
This is an introductory PowerPoint graphing. The PowerPoint includes:
-Different types of graphs
-Vocabulary used to construct a graph
-How to construct a line graph
Notes of formatted is such a way that they can easily be used in A.V.I.D. Cornell Note style with the heading being used as the question in the left column and the notes for the right column.
Subjects:
Grades:
5th - 7th
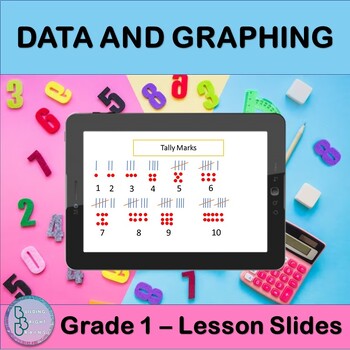
Data and Graphing | PowerPoint Lesson Slides Tally Chart Pictograph Bar Graph
Are you teaching your students about Data and Graphing? This resource is great for you for First Grade! Plenty of examples and application exercises are included. You can also easily convert this to a Google Slides lesson by dragging it into your Google Drive.What is included?✦ 6 total slides for notes, examples and applications.✦ All steps are animated to allow the teacher to explain them gradually. At the end of the lesson, students will be able to ✦ Make a Tally Chart✦ Make a Pictograph✦ Read
Grades:
1st - 2nd
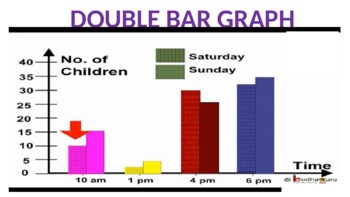
Double Bar Graph Powerpoint
The presentation contains:Learning Objectives.Definition of a double bar graph.Parts of a double bar graph.Difference between bar graph and double bar graph.Tips for construction of double bar graph.Steps to construct double bar graph with an example.To read and interpret the double bar graph.
Subjects:
Grades:
5th - 10th, Staff
Also included in: Data Representation Powerpoint
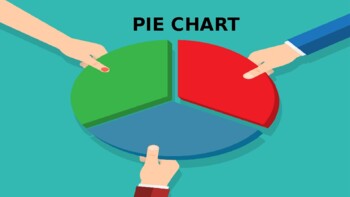
Pie Chart Powerpoint
The presentation contains:Learning Objectives.Definition of a Pie Chart.Tips for construction of pie chart.Steps to construct a pie chart with an example.Scaling and drawing a pie chart.Read and Interpret a pie chart.
Subjects:
Grades:
5th - 10th, Staff
Also included in: Data Representation Powerpoint
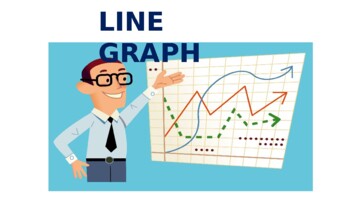
Line Graph Powerpoint
The presentation contains:Learning objectives.Definition of a line graph.Parts of a line graph.Tips for construction of line graph.Steps to construct line graph with an example.Reading and Interpreting a line graph.Advantage of line graph.
Subjects:
Grades:
5th - 10th, Staff
Also included in: Data Representation Powerpoint
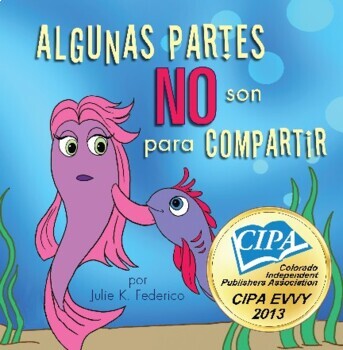
Algunas Partes NO Son Para Compartir: How to prevent child abuse
This download comes with a teacher study guide and audio.This Viaje cdownloadon un par de amable pececitos mientras aprenden sobre cuales partesde nuestro cuerpo pueden ser compartidas con otros. Los niños aprenderán el tipo de contacto apropiado y establecerán sus límites, de una forma no amenazante. La consejera escolar, Julie Federico, inicia una conversación acerca de los límites del cuerpo en Algunas partes no son para compartir. A los niños les gustará aprender sobre sus cuerpos, mientras
Grades:
PreK - 5th
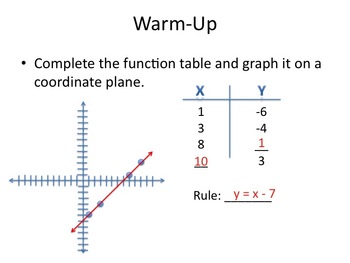
Graphing Linear Equations (focus on Real-Life Situations)
This PowerPoint can be used to introduce students to graphing linear equations. It should be played as a slideshow, where it steps students through linear equations by starting with the basic idea of graphing a function. The presentation ramps up to focusing on real-life situations that might be represented by a function. The show ends by looking at different graphs and asking students to think of a real-world situation that might match the given graph.
Grades:
5th - 8th
CCSS:
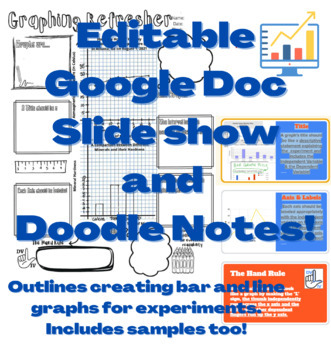
Scientific Graphing EDITABLE Google Slide Show with Keys and Doodle Note Sheet
This Slide Show does a wonderful job outlining key aspects of graphs including: Line and bar graphs, accurate titling, axis, and scaling. The doodle note sheet gives two examples of correct graphs, in addition to encouraging students creativity. It will help your students create their own graphs to represent their data in future experiments from start to finish.
Grades:
5th - 9th
Types:
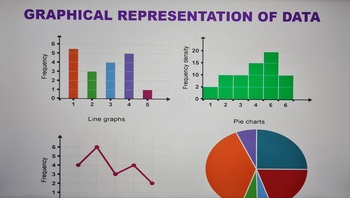
Graphical Representation of Data Powerpoint
The presentation contains the follows:1) BAR GRAPH Learning objectives. Definition of a bar graph. Parts of a bar graph. Tips for construction of bar graph. Steps to construct bar graph with an example. Types of bar graph. Advantages of bar graph. 2) DOUBLE BAR GRAPH Learning Objectives. Definition of a double bar graph. Parts of a double bar graph. Difference between bar graph and double bar graph. Tips for construction of double bar graph. Steps to construct double bar graph wit
Subjects:
Grades:
5th - 9th, Staff
Showing 1-24 of 83 results

