19 results
Graphing simulations for homeschool
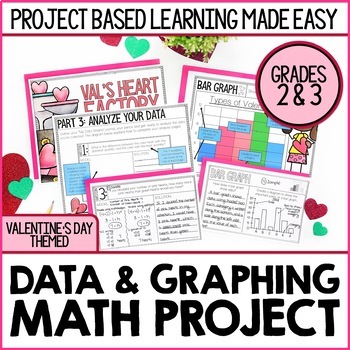
Valentine's Day Math Project | Conversation Hearts Graphing Lesson & Activity
This Valentine's Day-themed math project introduces your students to four methods for displaying data: Frequency TablesBar GraphsPictographsLine Plots Your students will record observations about each method for displaying data and compare/contrast methods for collecting data. Students will then use this knowledge to solve a problem for Val’s Heart Factory. Love this project idea, but planning to teach graphing at a different time of year? Sal's Sweet Factory will be a perfect fit for your class
Subjects:
Grades:
2nd - 3rd
Types:
Decimals Project based learning Monster Ice Cream Parlor
Welcome to The Monster Ice Cream Parlor Decimal focused project-based learning! In this student-tested and approved project, students jump into ownership of the monster ice cream parlor. They create flavors, set prices, and graph their sales all while practicing adding, subtracting and multiplying decimals, and graphing. Included in this ready to use project:- Student pages for building a monster ice cream parlor- Student pages for calculating revenue- Student pages for graphing revenue and s
Subjects:
Grades:
4th - 6th
Types:
Also included in: 6th grade math MEGA resource bundle

Line of Best Fit and Scatterplots
Who doesn't love a good mystery?!!!! In this engaging students use a real life scenario to apply scatterplot data of shoe size and height and the line of best fit to capture the correct suspect. This product has lots of great reviews! Many middle school math teachers state this was a great way to review the concept of line of best fit and scatterplots. Aligned to CCSSM8.SP.A.2 and CCSSM8.SP.A.3This activity is also available in a bundle at a discounted rate:Scatterplots and Line of Best
Subjects:
Grades:
7th - 9th
Types:
Also included in: Line of Best Fit and Scatterplots: The Bundle
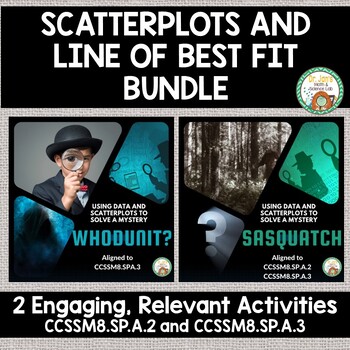
Line of Best Fit and Scatterplots: The Bundle
This bundle includes 2 engaging activities where students can apply the skills of plotting points in a scatterplot, making a line of best fit, and finding the slope of the line to find missing data. Fun scenarios of Sasquatch and a crime scene hook kids into learning. Please leave feedback, you can earn TpT credits for future purchases. If you enjoy these activities consider following my store as I work to increase my middle school math inventory. Check out my other middle school math produc
Subjects:
Grades:
7th - 9th
Types:
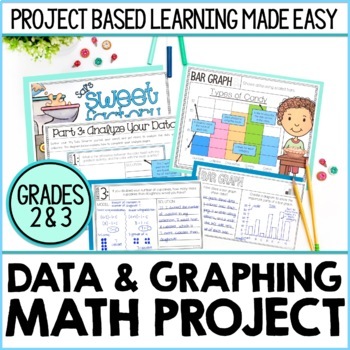
2nd & 3rd Grade Data and Graphing Math Project | Bar Graphs, Line Plots & More
This graphing math project introduces your students to four methods for displaying data: ★ Frequency Tables ★ Bar Graphs ★ Pictographs ★ Line Plots ★Your students will have the opportunity to record observations about each method for displaying data and compare/contrast methods for collecting data. They will then use this knowledge to solve a problem for Sal’s Sweet Factory. ***************************************************************************THE BIG PROBLEM YOUR STUDENTS WILL SOLVE:Sal's
Subjects:
Grades:
2nd - 3rd
Types:
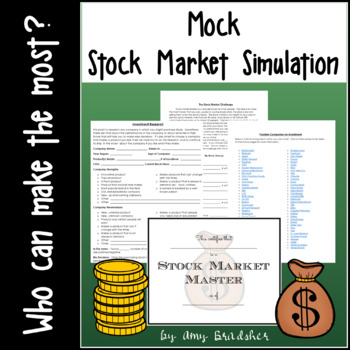
Stock Market Simulation Challenge I Digital Learning
What better way to understand how the stock market works than to simulate it in your classroom? To make it a competitive project! This simulation contains the project worksheets, hyperlinks, research guides, and graphs needed for your students to "purchase" their own stock and track it's value over time. This project was written to accompany Gary Paulsen's book "Lawn Boy," but it can be used with or without this book.These activities are suitable for upper-elementary and middle grade students
Subjects:
Grades:
5th - 7th
Types:
Scatterplots and Line of Best Fit
This engaging activity allows students to apply their knowledge of slope, scatterplot data, and line of best fit to figure out how tall Sasquatch is. Taking the role of engineers, students use a foot print of sasquatch to approximate his height which is needed to construct a trap. An engaging newspaper article sets the scene of the recent Sasquatch sightings at the local park. This activity is also available in a bundle at a discounted rate:Scatterplots and Line of Best Fit BundleAligned to C
Subjects:
Grades:
7th - 9th
Types:
Also included in: Line of Best Fit and Scatterplots: The Bundle
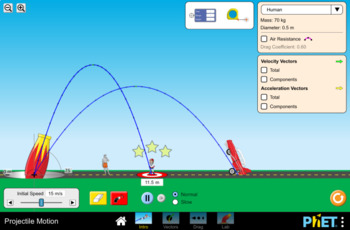
Projectile Motion Simulation Lab- PhET
This handout is meant to accompany the Projectile Motion simulation found here: https://phet.colorado.edu/en/simulation/projectile-motion
45 minute lesson time
This lab can be used to teach a range of concepts such as:
-Relationships between independent/manipulated and dependent/responding variables
-Forces in motion
-Projectile Motion
-The relationship between firing angle and distance traveled
-Graphing independent/ dependent variables
-Creating data tables
Subjects:
Grades:
6th - 12th, Higher Education, Adult Education
Types:
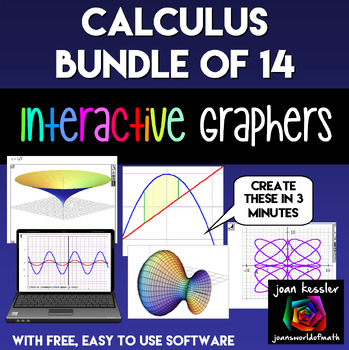
Calculus Bundle of Interactive Graphing Apps plus software
Your Calculus students will love these interactive simulations and demonstrations of graphical calculus. These Dynamic moving 3D graphs will help your Calculus students visualize the concepts you teach. Engaging and so easy to use, you will be demonstrating important concepts in AP Calculus AB, BC, Honors or traditional Calculus 1 and 2 in minutes. Project from your computer onto a screen or whiteboard. No internet needed.There are 14 Applets Included: ✓ Animated End Behavior ✓ Animated Functio
Grades:
11th - 12th, Higher Education
Types:
INVESTING IN THE STOCK MARKET : an in-class simulation guide
This is a 29 page package to support teachers in running a 24 day stock market simulation in their grade 5-10 classroom. I have used a version of this in my class for several years now and the kids LOVE it! I have adjusted it and perfected it to include a 24 page student booklet, an evaluation sheet, and a three page SPECIFIC teacher instruction manual.
I offer this exact resource IN FRENCH. Check out La classe de Mme Geneviève for other Math Resources and French Immersion Resources.
Thank
Subjects:
Grades:
5th - 10th
Types:
LA BOURSE : UNE SIMULATION EN CLASSE (Stock Market simulation kit)
This is a 28 page package to support teachers in running a 24 day stock market simulation in their grade 5-10 classroom. I have used a version of this in my class for several years now and the kids LOVE it! I have adjusted it and perfected it to include a 24 page student booklet, an evaluation sheet, and a three page SPECIFIC teacher instruction manual.The entire content is IN FRENCH for the French Immersion--or francophone--classroom. I also offer this exact product IN ENGLISH, if you are int
Subjects:
Grades:
5th - 10th
Types:
Systems of Equations: Finding Buried Treasure with Solutions
This engaging activity gives students the opportunity to practice graphing and solving systems of equations in a fun way. Students work to find 3 "buried treasures" based on information they are given about people walking or riding to meet at the buried treasure location. Graphing lines, writing equations for lines, and finding solutions to systems of equations are all skills they will practice with this activity. Answer keys included.
Please leave feedback and if you like this product con
Grades:
7th - 9th
Types:

A Fishy Situation
The multiple day activity is a simulation requiring students to collect, organize, categorize, and analyze data concerning a fish population in a lake. Students will discuss sampling, create various graphs, and create their own research plan. Career ties may be biologist, state wildlife and fisheries agents, and environmentalist.
Subjects:
Grades:
6th - 8th
Types:

Supply and demand
A classroom activity where student build their own demand and supply curves based on what they are willing to pay (or be paid) for a clean room. Students must reason quantitatively and use units common in economics to solve problems in market equilibrium. Algebra- linear equations, systems of equations, and functions.
Subjects:
Grades:
9th - 12th, Higher Education, Adult Education
Types:
CCSS:
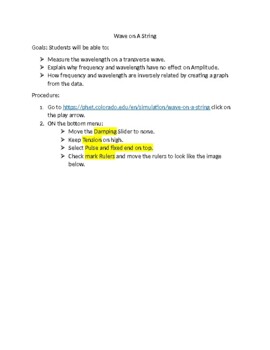
Wave on a String Virtual PHET Lab
Goals: Students will be able to:Ø Measure the wavelength on a transverse wave.Ø Explain why frequency and wavelength have no effect on Amplitude.Ø How frequency and wavelength are inversely related by creating a graph from the data.
Subjects:
Grades:
7th - 11th, Adult Education
Types:
NGSS:
MS-PS4-1
, HS-PS4-1
Also included in: Physical Science Virtual Lab Bundle
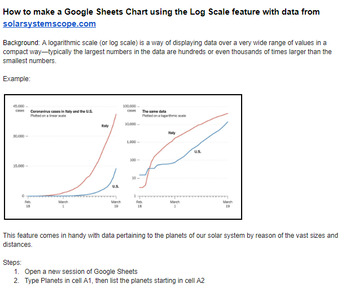
Google Sheets Chart using Log Scale feature with data from solarsystemscope.com
Instructions on how to make a Google Sheets Chart using the Log Scale feature with data from solarsystemscope.com
Subjects:
Grades:
5th - 12th, Higher Education, Adult Education
Types:
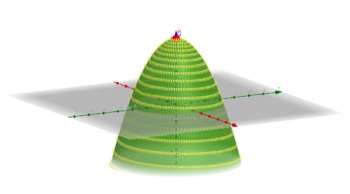
Three Dimensional Curves and Surfaces. 3D - Geometria Analitica
Use GeoGebra' tools for well understanding parametric equations and three dimensional analytic geometry ParaboloideIn mathematics, a parametric equation defines a group of quantities as functions of one or more independent variables called parameters. Parametric equations are commonly used to express the coordinates of the points that make up a geometric object such as a curve or surface, in which case the equations are collectively called a parametric representation or parameterization (alterna
Subjects:
Grades:
10th - 12th, Higher Education
Types:
Demonstrate Acute, Right, Obtuse, Straight Angles with an Animated Excel File
Simple to use animated Excel file for in class demonstration of acute, right, obtuse, and straight angles. Move scroll bars, select option buttons, type numbers, and watch these mathematical concepts come alive. You must use Microsoft Excel that is capable of opening file formats in either .xlsx or .xlsm.
Grades:
6th - 12th
Types:

Terminal Velocity Simulation Written on a Spreadsheet
EXPAND THE USE OF SPREADSHEETS IN YOUR PHYSICS CURRICULUM... This Physics activity good for all levels of Physics is a free preview of "The Spreadsheet Lab Manual." It guides students to construct a mathematical simulation starting from a blank spreadsheet that quantitatively models freefall with air resistance as an object reaches terminal velocity. Students will be guided through an inquiry based simulation as they answer assessment questions and gain skills on spreadsheets while manipulati
Subjects:
Grades:
9th - 12th, Higher Education, Adult Education, Staff
Types:
Showing 1-19 of 19 results


