87 results
Graphing workbooks for homeschool
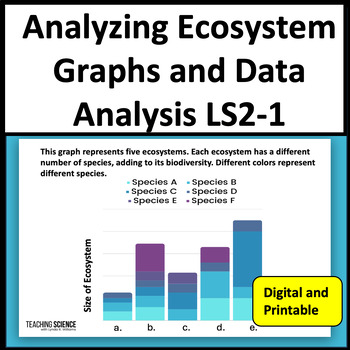
Analyzing Ecosystem Graphs & Data Analysis Resource Availability MS LS2-1
Do your students need practice with analyzing ecosystem graphs? These science graph worksheets include data analysis on resource availability in ecosystems. Students will use critical thinking to answer the questions. Great for Science TEST Prep! This set includes 20 pages of science graphs and diagrams with questions. You will get a printable PDF with a link to Google Slides. Great for CAST and STAR Test Prep.This Ecosystem Graph Practice Unit Includes:•20 printable pages of charts and diagrams
Subjects:
Grades:
6th - 8th
Types:
NGSS:
MS-LS2-1
Coordinate Plane Graphing & Distance | Plotting Points, Quadrants | 6th Grade
Looking for an exciting application for plotting points coordinate planes, identifying quadrants, and calculating distance on graphs? How about a zombie apocalypse? In this print-and-go, EASEL-compatible activity, students must help the CDC stop an outbreak by plotting outbreak locations, analyzing where to place a laboratory and hospital, and computing the distance between infected individuals.What's included?Your purchase includes two formats of the same activity:Print PDF. Print and manually
Subjects:
Grades:
6th
Types:
CCSS:
Also included in: Geometry Activity BUNDLE | 6th Grade Math | Surface Area, Volume, Nets
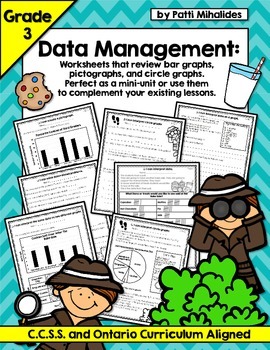
Graphing/Data Management Third Grade Worksheets (bar, circle, pictographs)
This is a ten-page collection of Math worksheets that covers the following: • comparing the same data on a bar graph and pictograph• writing about what one interprets from a graph (students are encouraged to consider the data on a higher level) • transferring data from a bar graph to a pictograph (two opportunities to practice this, one more challenging than the other) • solve data related problems using addition and subtraction • respond to higher level thinking, open-ended questions (e.g. Why
Grades:
2nd - 4th
Types:
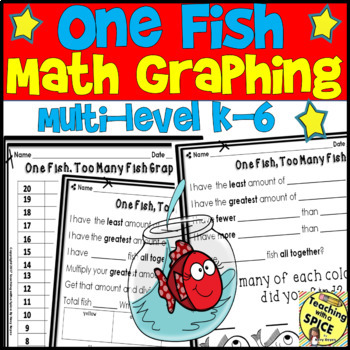
RHYME TIME Week Graphing fish / Math / Distance Learning / Read Across America
RHYME TIME One Fish, Too Many Fish Goldfish Graphing is designed for multi-level K-6! It is easy enough for Kindergarten and great enough for higher grades with fractions included. 12 PAGES TOTAL PACKET SEE PREVIEW FOR DEALS!!!★RHYME TIME Multiplication Color by Number Skunk with a Hat★RHYME TIME Equivalent Fractions Color by Number Skunk with a Hat★RHYME TIME Equivalent Fractions Color by Number Mustached Man★Multiplication Color By Number★RHYME TIME ELA and MATH HUGE PACKET!!!!!!!! 80+pages★
Subjects:
Grades:
PreK - 6th
Types:
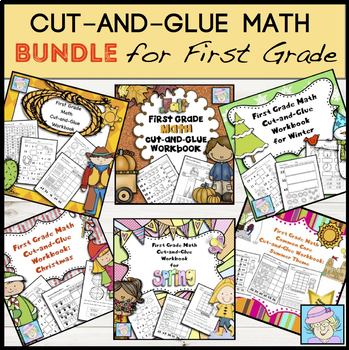
First Grade Math Practice Addition Subtraction Shapes Place Value BUNDLE
This set includes all 6 cut and glue math workbooks for first grade. It has a total of 211 worksheets pages PLUS 3 sets of digital Boom™ Cards! Each set of worksheets covers ALL 21 of the first grade Common Core Standards in math and has 2 or more pages devoted to most standards.★★NOW INCLUDED: DIGITAL BOOM CARDS! ★★This product now includes 3 sets of Boom Cards! The Boom Cards are digital task cards for use on Boom Learning.** CLICK HERE TO PLAY A PREVIEW OF THE BOOM CARDS*****READ MORE ABOUT
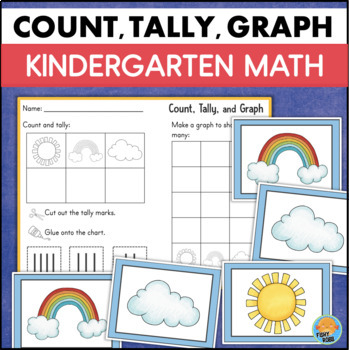
Kindergarten Counting Objects to 5 Sorting Creating Simple Graphs Tally Marks
This is a set of sorting, counting, and graphing activities for kindergarten. It's a great way to introduce young learners to the concept of data collection.These activities involve matching, sorting, counting sets of objects, representing numbers, cutting and pasting.INCLUDES:5 different sets of sorting/counting cards (total of 50 cards)5 graphing worksheetsAnswer keysDigital activitiesAfter giving students a set of cards to work with, they will:sort the cardscount how many there are of each ob
Grades:
K
Types:
CCSS:
Also included in: Kindergarten Math BUNDLE Ways to Show A Number ID Counting Objects to 10
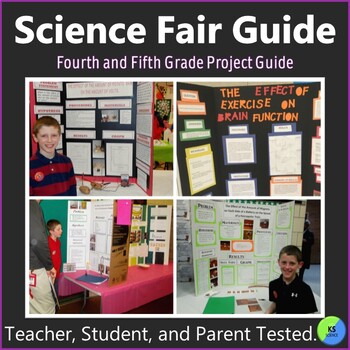
Science Fair Project Guide | Experiment Journal and Worksheets For Grade 4 And 5
A step by step science fair guide with workbook pages, tips, blank science journal, and poster board layout. It helps fourth and fifth graders create age-appropriate experiments with less parental guidance. Teachers can use as a classroom unit on the scientific method, science processes, and to help complete a whole-class project. We will help make the science fair a fun and rewarding experience.Don't be nervous when your child says they want to participate in the science fair.Nervous about pl
Subjects:
Grades:
4th - 6th, Staff
NGSS:
3-5-ETS1-3
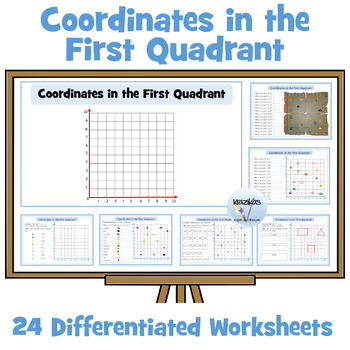
Coordinates in the First Quadrant Worksheets
This resource contains a 24 page workbook / 24 differentiated worksheets on coordinates in the first quadrant. Answers are provided.Tasks include:locating coordinatesplotting coordinatesfinding missing coordinatesYou may also be interested in:Coordinates in the First Quadrant PowerPoint LessonThis is an accompanying highly visual and interactive 50-slide PowerPoint lesson on coordinates in the first quadrant. The PowerPoint clearly explains and visually demonstrates the following:gridsx and y ax
Grades:
4th - 8th
Types:
Also included in: Coordinates in the First Quadrant
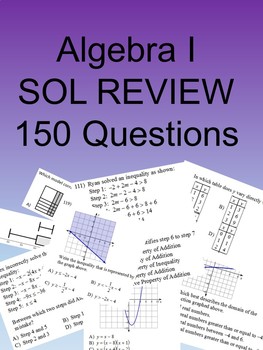
Algebra I 150 Multiple Choice SOL type questions
I have recently updated this product so that it is editable and has an easier to read format. In addition to a pdf you will receive a docx file that has the questions as images. You can delete questions, rearrange, or insert your own questions. 150 mostly multiple choice questions with a few multiple answers and free response as well similar to questions from the Virginia SOLs. Questions cover the entire algebra I curriculum. Use as Final Exam review or SOL Review.There are at least two que
Grades:
7th - 10th
CCSS:
Making Science Charts and Graphs
A simplified look at making charts and organizing data in science.
-Data Charts
-Circle Graphs
-Bar Graphs
-Line Graphs
-Key Vocabulary List
-Quiz/Assessment
-Activity - Practice
-Teacher answer key for quiz and activity
Thanks for taking the time to stop by my store!
Mrs. Degs
Teaching Science Well
Blog: http://teachingsciencewell.wordpress.com/
Facebook: https://www.facebook.com/TeachingScienceWell
TPT: http://www.teacherspayteachers.com/Store/Teaching-Science-Well-Science-Resources
Pi
Subjects:
Grades:
3rd - 10th
5th Grade Daily Math - Bell Ringers - Morning Work
This booklet contains 32 weeks (8 months) of daily math! Monday – Number StrandTuesday - Patterns and RelationsWednesday - Statistics and ProbabilityThursday - Shape and SpaceFriday – Number StrandPuzzle- Brain Buster Algebraic Equation PuzzlesDaily math can be used to keep concepts fresh, introduce math and spark mathematical conversations. It works well to have students settle in after a break while getting to work on their math. How you use this resource is up to you! Some of the concepts get
Grades:
4th - 6th
Types:
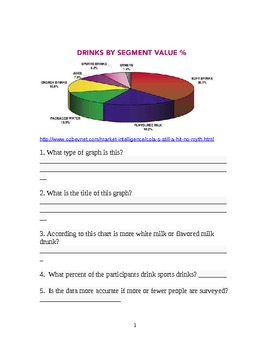
Charts and Graphs for Middle School
Included are thiry-eight graphs, charts, maps, flowcharts, tables and other graphics. These are real data maps taken from the Internet (all sources noted). Under each graphic are five questions that can be answered by using the information provided. The questions range from titles, mean, meadian, to create your own graph.
The pages can be copied back to back to make a workbook. I use this workbook as bellwork while I am taking attendance. Everyday the students answer the question. (I requi
Subjects:
Grades:
6th - 9th
Types:
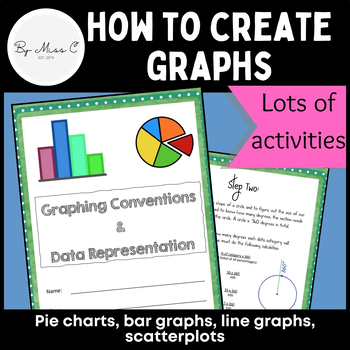
Guide to graphs: Pie charts, bar graphs, line graphs, scatterplots + activities
This is a fantastic resource for introducing students to graphing and data representation. This booklet will take students through the uses for particular graphs and how to construct them. At the end of each module, there are activities for students to complete, to practice their graphing skills. Answer key is included, making this a no-prep activity. This booklet covers: - why we visually represent data- pie charts and how to create them - bar graphs and how to create them - line graphs and how
Subjects:
Grades:
6th - 12th, Higher Education, Adult Education
Types:
CCSS:
TI-Nspire Graphing Calculator for STAAR Algebra 1 EOC (First Edition)
The majority of the STAAR End of Course Algebra 1 assessment items could have been answered using a graphing calculator. These instructions are designed to give students speed, accuracy, and confidence.Topics Covered on the Nspire:(A.1) The student understands that a function represents a dependence of one quantity on another and can be described in a variety of ways. (D) The student represents relationships among quantities using concrete models, tables, graphs, diagrams
Subjects:
Grades:
7th - 12th
Types:
Also included in: STAAR Algebra 1 EOC Bundle
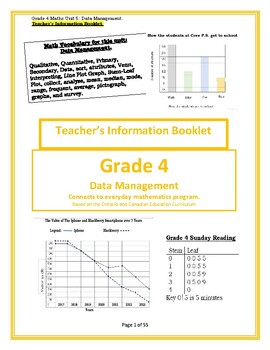
Grade 4 Maths Unit 5: Data Management.
Grade 4 Maths Unit 5: Data Management.Grade 4 Math Program Based on the Ontario and Canadian Curriculum. 100% connected to the Ontario and Canadian 2022 Curriculum. 12 Activities to develop and strengthen maths skills in Data Management (Graphing) including central tendency: Mean, Mode, Range, and Median.Parents/Teach communication page.New* Identification and Management of Emotions.* Please see the preview to see the complete booklet.Other Grade 4 Maths Complete Workbook Program for the entire
Subjects:
Grades:
4th
Graphing Booklet #1: The Basics of the Coordinate Plane
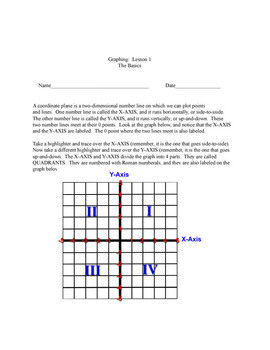
I created this booklet for use in my classroom. I have also used it to help students I tutor. I teach geometry, and I noticed that I had a few students who still could not plot points correctly. I made this booklet, which includes step-by-step lessons and activities on the basics of the coordinate plane (the x and y-axis, the origin, the quadrants, ordered pairs, plotting points), and it has helped the students tremendously. When I shared this booklet with other teachers, they requested copi
Grades:
4th - 9th
Grade 4 Maths Unit 3. Geometric and Spatial Reasoning
Grade 4 Maths Unit 3. Geometric and Spatial Reasoning: Relationships of 2D Shapes and 3D Solids. Grade 4 Math Program Based on the Ontario and Canadian Curriculum. 100% connected to the Ontario and Canadian 2022 Curriculum. 13 Activities to develop and strengthen maths skills in Spatial Geometry.Parents/Teach communication page.New* Social Emotional (Identification and Management of Emotions)* Please see the preview to see the complete booklet.Other Grade 4 Maths Complete Workbook Program for th
Subjects:
Grades:
4th
Types:
Virginia Standards of Learning Geometry Workbook
This workbook is designed to help students obtain mastering of each Virginia Geometry standard.
Topics Include:
G.1 The student will construct and judge the validity of a logical argument consisting of a set of premises and a conclusion. This will include
G.1.a identifying the converse, inverse, and contrapositive of a conditional statement;
G.1.b translating a short verbal argument into symbolic form;
G.1.c using Venn diagrams to represent set relationships; and
G.1.d using deductive reaso
Subjects:
Grades:
8th - 11th
Types:
Grade 4 Maths Unit 7: Transformation Geometry (Movements on a Grid).
Grade 4 Maths Unit 7: Transformation Geometry (Movements on a Grid). Grade 4 Math Program Based on the Ontario and Canadian Curriculum. 100% connected to the Ontario and Canadian 2022 Curriculum. 8 Activities to develop and strengthen maths skills in Transformational Geometry, and movements on a grid.Parents/Teach communication page.New* Social-Emotional Learning (SEL) Skills and Stress Management and Coping.* Please see the preview to see the complete booklet.Other Grade 4 Maths Complete Workbo
Subjects:
Grades:
4th
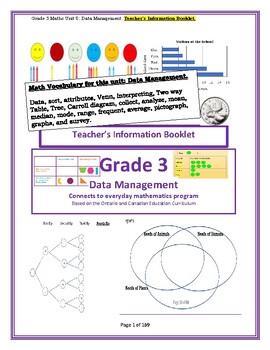
Grade 3 Maths Unit 5: Data Management.
Grade 3 Maths Unit 5: Data Management.Please see “Preview” for more information on the complete workbook. Grade 3 Maths Program Based on the Ontario and Canadian Curriculum. 100% connected to the Ontario and Canadian 2022 Curriculum with a rubric.With connections to provincial sample questionings, to introduce the math language to the grade 2 students. Save time and money on your maths program. Connects to many of the grade 2 social sciences, including financial and coding curriculum. Social E
Subjects:
Grades:
3rd
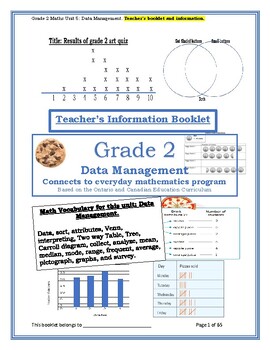
D1. Data Literacy-Grade 2 Maths Unit 5: Data Management.
D1. Data Literacy-Grade 2 Maths Unit 5: Data Management.Please see “Preview” for more information on the complete workbook.Grade 2 Maths Program Based on the Ontario and Canadian Curriculum. 100% connected to the Ontario and Canadian 2022 Curriculum with a rubric.With connections to provincial sample questionings, to introduce the math language to the grade 2 students. Save time and money on your maths program. Connects to many of the grade 2 social sciences, including financial and coding curr
Subjects:
Grades:
2nd
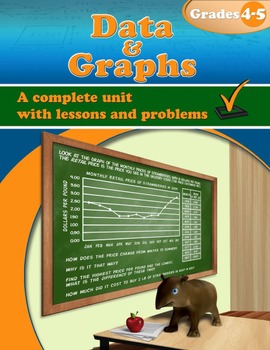
Data and Graphs — Grades 4-5 (Distance Learning)
Data and Graphs — Grades 4-5 is a unit that covers common statistical graphs and some related topics. It is a worktext, containing both the “text” (instruction) and the “work” (exercises and problems).The unit starts with bar graphs, histograms, and various kinds of line graphs. The goals for the study of bar graphs and line graphs are listed here. The student should learn to:1. Read bar graphs, including double bar graphs, and answer questions about already plotted data.2. Draw bar graphs and
Subjects:
Grades:
4th - 5th
Types:
Also included in: Grade 4 Math Units Bundle (Distance Learning)
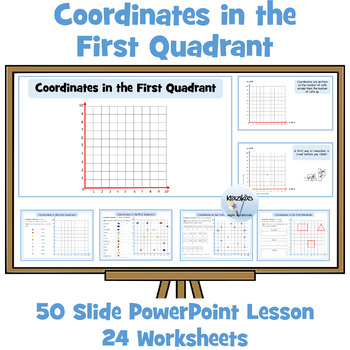
Coordinates in the First Quadrant
This bundle contains a PowerPoint lesson and a set of differentiated worksheets on coordinates in the first quadrant.PowerPoint LessonThis is a highly visual and interactive 50-slide PowerPoint lesson on coordinates in the first quadrant. The PowerPoint clearly explains and visually demonstrates the following:gridsx and y axesthe originhow to locate coordinateshow to plot coordinateshow to write coordinatesOpportunities are provided within the PowerPoint for students to locate and plot coordinat
Grades:
3rd - 7th
Mastering the Algebra 1 STAAR EOC Test (Second Edition)
In 2017, the TI-nspire could be used to answer 38 out 54 of questions on STAAR End of Course Algebra 1 Exam. This instruction manual and workbook is designed to help teachers and students increase scores and graduation rates for taking the Algebra End of Course Exam.
Topics Covered on the Nspire:
(A.2) Linear functions, equations, and inequalities. The student applies the mathematical process standards when using properties of linear functions to write and represent in multiple ways, with an
Subjects:
Grades:
7th - 12th
Types:
Also included in: How to use the TI-Nspire for Algebra 1, Geometry and Algebra 2
Showing 1-24 of 87 results


