195 results
Graphing simulations for GATE
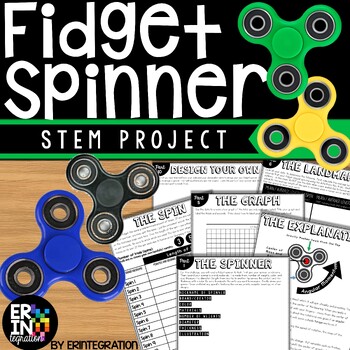
Fidget Spinner STEM Challenge Activities and Science Experiment
The ORIGINAL Fidget Spinner Stem Challenge & Science Lab! Discover the science of fidget spinners with this engaging and low-prep STEM activity. Practice scientific method with an exploration of variables, data collection, graphing, mean/average, and more...all while having fun!This self-paced, fidget spinner activity is print-and-go. Each activity sheet guides students through the project. STEM Challenge Overview:Students will use the included visual directions, graphic organizers, chart
Subjects:
Grades:
3rd - 6th
Types:
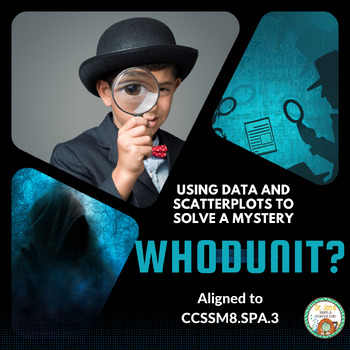
Line of Best Fit and Scatterplots
Who doesn't love a good mystery?!!!! In this engaging students use a real life scenario to apply scatterplot data of shoe size and height and the line of best fit to capture the correct suspect. This product has lots of great reviews! Many middle school math teachers state this was a great way to review the concept of line of best fit and scatterplots. Aligned to CCSSM8.SP.A.2 and CCSSM8.SP.A.3This activity is also available in a bundle at a discounted rate:Scatterplots and Line of Best
Subjects:
Grades:
7th - 9th
Types:
Also included in: Line of Best Fit and Scatterplots: The Bundle
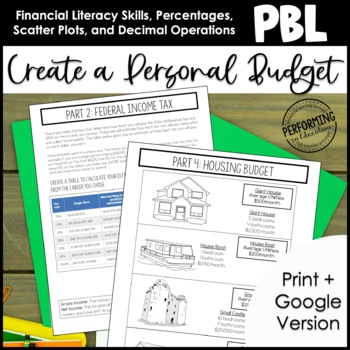
Project Based Learning: Create a Personal Budget 6th Grade Math
Project based learning for 6th grade math skills is awesome! Teach your students math skills and financial literacy through this project-based learning activity. Your students will practice decimal operations (money), work with percentages, and create scatter plots. Challenge activities allow for it to be used in 6th grade as well. It includes a teacher guide walking you through each step.Your students will get their first peek at the process of creating a budget! Kids love having choices, and t
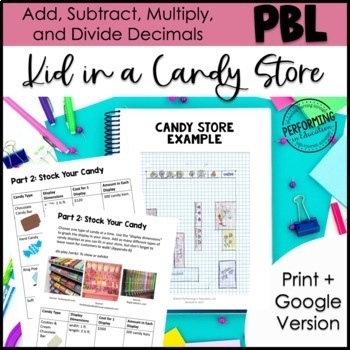
Add, Subtract, Multiply Decimals Project Based Learning | Valentine's Day
Looking for an exciting and engaging way to teach your 5th graders about adding, subtracting, and multiplying decimals? Look no further than our "Adding, Subtracting, Multiplying Decimals Project Based Learning for 5th" math project! This is a great PBL for Valentine's Day or any other day of the year with the engaging candy shop theme.This week-long math project is designed to help students develop a deep understanding of these key mathematical concepts through hands-on activities that challeng
Subjects:
Grades:
4th - 6th
Also included in: 5th Project Based Learning Math Starter Kit Bundle
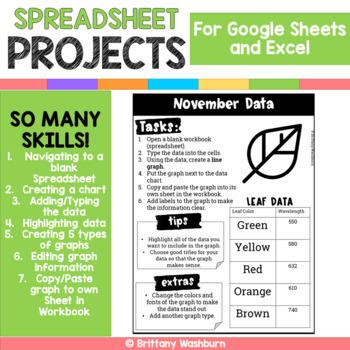
Google Sheets and Excel Spreadsheet Projects {12 Months}
12 projects with monthly themed data for students to practice creating spreadsheets in Google Sheets or Excel. There are 2 optional rubrics included too if you want to make this an assessment tool.SO MANY SKILLS!1. Navigating to a blank Spreadsheet2. Creating a chart3. Adding/Typing the data4. Highlighting data5. Creating 5 types of graphs6.Editing graph information7.Copy/Paste graph to own Sheet in Workbook1 for each month of the year (I stayed away from religious holidays)Works for any spreads
Grades:
2nd - 5th
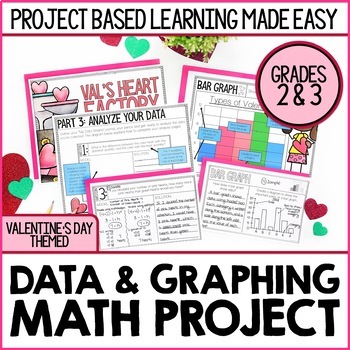
Valentine's Day Math Project | Conversation Hearts Graphing Lesson & Activity
This Valentine's Day-themed math project introduces your students to four methods for displaying data: Frequency TablesBar GraphsPictographsLine Plots Your students will record observations about each method for displaying data and compare/contrast methods for collecting data. Students will then use this knowledge to solve a problem for Val’s Heart Factory. Love this project idea, but planning to teach graphing at a different time of year? Sal's Sweet Factory will be a perfect fit for your class
Subjects:
Grades:
2nd - 3rd
Types:
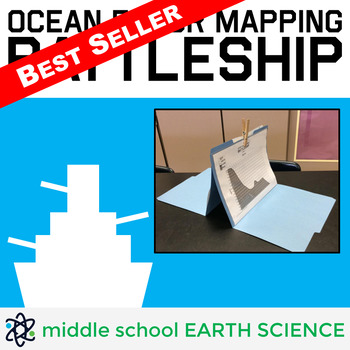
Ocean Floor Mapping Battleship Game
Teacher Review: "My students are obsessed with this activity! They even ask to play during indoor recess!" - Turner's Teaching Troop (January 22, 2020)Ocean Floor Mapping Battleship includes 36 unique maps of the ocean floor, a recording sheet, a detailed lesson plan with suggested pre-game activities, a blank map students can use to draw their own ocean floor, a diagram showing the layers of the ocean, and easy to follow game instructions. Field tested with sixth-graders, this game challenges s
Subjects:
Grades:
5th - 9th
Types:
CCSS:
Also included in: Earth Science Games Bundle
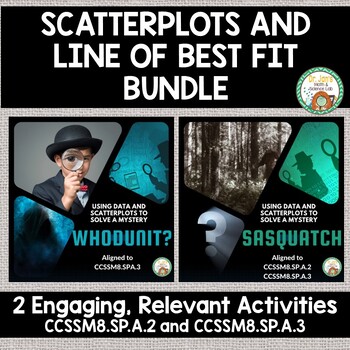
Line of Best Fit and Scatterplots: The Bundle
This bundle includes 2 engaging activities where students can apply the skills of plotting points in a scatterplot, making a line of best fit, and finding the slope of the line to find missing data. Fun scenarios of Sasquatch and a crime scene hook kids into learning. Please leave feedback, you can earn TpT credits for future purchases. If you enjoy these activities consider following my store as I work to increase my middle school math inventory. Check out my other middle school math produc
Subjects:
Grades:
7th - 9th
Types:
Valentine's Day Heart Candy Stacking STEM Challenge
Valentine Day Heart Candy Stacking STEM Challenge❤️ will get your students collecting data, averaging, analyzing data, and graphing during the holiday. ⭐This activity can also be used for STEAM Activities, STEM After School Programs, Summer Programs, Clubs, Maker Spaces, or at home. ⭐This product is included in my STEM BUNDLE #2 Challenge! ⭐Other Products you might like:➩STEM Challenges For the Whole Year Bundle➩Back to School STEM Challenge➪STEM Waterbottle Challenges➩STEM Valentines Day Chal
Subjects:
Grades:
3rd - 7th
Types:
Also included in: STEM Challenges Entire Year includes End of the Year STEM Activities
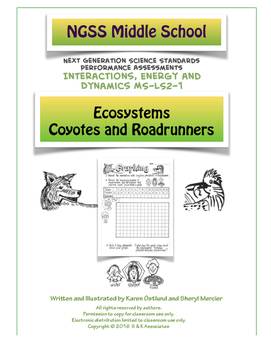
Ecosystems- Roadrunners and Coyotes NGSS Middle School LS2-1
Turn your students into an active ecosystem. This activity is similar to the classic Oh Deer simulation with a roadrunner and coyote twist. This sequence of NGSS aligned activities/assessments includes two simulation activities in which students are in the roles of a population of roadrunners, a predator (coyote), and resources (food, water, shelter). Students collect, graph, and analyze data to look for cause and effect relationships in an ecosystem. Reading and writing pages are included along
Subjects:
Grades:
5th - 7th
Types:
NGSS:
MS-LS2-1
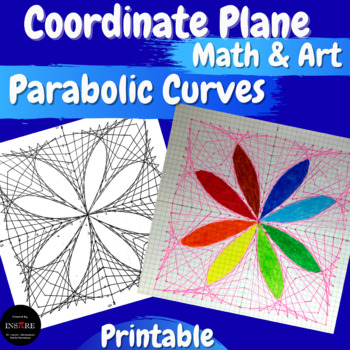
Coordinate Plane Graphing Parabolic Curves Math & Art 4 Quadrants String Art
Geometry Math Project - Practice ordered pairs plotting by using this fun activity. Make beautiful parabolic curves by drawing a series of straight lines.It's a great activity for the First Days of School, Back to School, Summer Camp, Summer School, or End of the Year.Can we draw a beautiful picture using only straight lines? Yes, we can. Check out this math & art project.Why do students love mystery picture graphing? They love discovering the next parts of the picture and guessing what it w
Subjects:
Grades:
6th - 9th
Types:
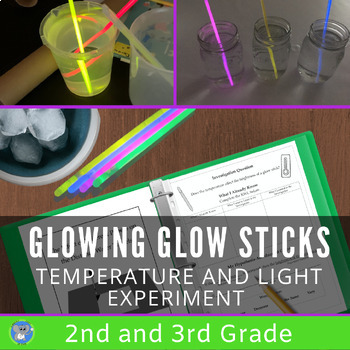
Chemical Reactions Glow Stick Science Experiment | Investigate Light | Grade 2 3
Excite students by investigating the speed of a chemical reaction using glowsticks. This experiment uses simple supplies, includes detailed directions to guide the teacher and students, and creates a memorable experience. NGSS Aligned, fun, and perfect for Halloween.Students will learn about chemiluminescence and chemical reactions. They will use data and observations to write a conclusion. Students will follow the scientific method to answer the question: Does temperature affect the brightne
Subjects:
Grades:
2nd - 5th
Types:
NGSS:
3-5-ETS1-3
, 2-PS1-4
, 2-PS1-1
, 2-PS1-3
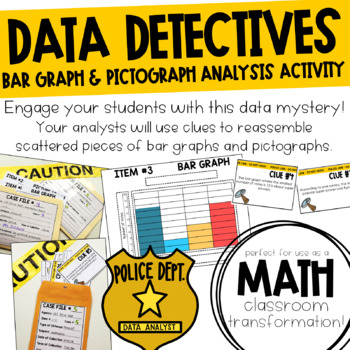
Data Detectives Bar Graph & Pictograph Mystery Activity
Engage your students with this data mystery! You left data in the classroom overnight and someone snuck in and completely scattered it. Oh no! In this activity, your students are data analysts who will use clues to reassemble the scattered pieces of bar graphs and pictographs.This product includes...4 graph starters for your students to complete (2 bar graphs, 2 pictographs)18 pieces (including some decoys) of graphs for your students to analyze and match to a graph starter8 cluesAND everything
Subjects:
Grades:
3rd - 4th
Types:
CCSS:
STEM Escape Room - The RMS Titanic
This STEM Escape Room Challenge is a set of five tasks for students to complete. There are a lot of different ways you can complete these five tasks. We do all five tasks over the course of a Friday afternoon in our classroom, or over a span of about 2 hours. You could also do these over the course of 2-3 class periods and students can pick up where they leave off each day. Student teams work at their own pace, they must complete the tasks in order and complete each task before they can move
Subjects:
Grades:
3rd - 7th
Types:
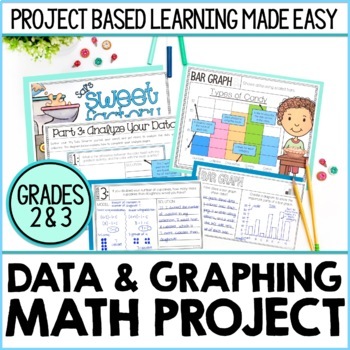
2nd & 3rd Grade Data and Graphing Math Project | Bar Graphs, Line Plots & More
This graphing math project introduces your students to four methods for displaying data: ★ Frequency Tables ★ Bar Graphs ★ Pictographs ★ Line Plots ★Your students will have the opportunity to record observations about each method for displaying data and compare/contrast methods for collecting data. They will then use this knowledge to solve a problem for Sal’s Sweet Factory. ***************************************************************************THE BIG PROBLEM YOUR STUDENTS WILL SOLVE:Sal's
Subjects:
Grades:
2nd - 3rd
Types:
Football Stats Math Project - Upper Elementary Math: Graphing and Analyzing Data
This Football Stats Project incorporates the use of line plots, stem and leaf plots, analyzing upward and downward trends in data and median, mode, range and outliers. I also incorporated discussion and higher order thinking skills. Students will apply these concepts and skills to football statistics that they will research - included are suggestions for websites to research and topics to research.This would be best for 4th, 5th or 6th grade math students.This resource includes slides that intro
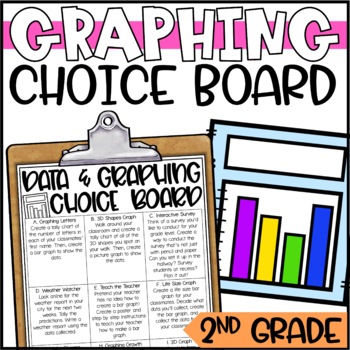
Data and Graphing Math Menu and Enrichment Activities
NO-PREP, 2nd Grade Data & Graphing Enrichment Projects and ChallengesThis graphing choice board is full of no-prep math challenges - perfect for 2nd grade math classes that need enrichment! Give early finishers the opportunity to explore these concepts in a deeper and meaningful way with this graphing math menu! These activities are perfect for your fast finishers and high flying students.This math menu can be used as a tic-tac-toe board, and is full of 9 highly engaging and cross-curricular
Subjects:
Grades:
2nd - 3rd
Types:
CCSS:
Also included in: 2nd Grade Math Menus and Choice Boards - Enrichment Activities

Statistics Survey Project - Project Based Learning (PBL) with Math
Watch your students dive into the world of math as they create, execute, and analyze their own survey! Students will demonstrate mastery of data gathering, survey sampling, developing appropriate survey questions, data tables, Direct Variation, discrete graphs, dot plots, box and whisker graphs, and calculating the inter-quartile range.The Unique Survey Project is highly engaging, capitalizing on the innate curiosity of the adolescent mind. You will love the low-prep instructional guide. Your st
Subjects:
Grades:
6th - 10th
Types:
Also included in: Fun with Ratios Activities Bundle - 7th Grade PBL with Math
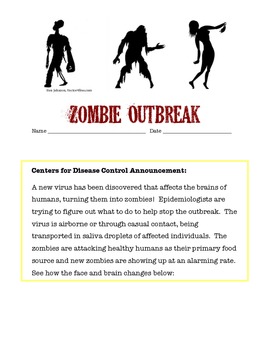
Investigating the Spread of a Viral Outbreak
Students in grades 5 - 9 model the spread of an infectious disease under the entertaining theme of a zombie outbreak. One student unknowingly is patient zero and students simulate the spread of an airborne illness. This highly engaging activity covers health topics, nature of science, and math skills as students graph data in a line plot. Higher level students can be challenged to find the function of the exponential growth of the outbreak.
Subjects:
Grades:
6th - 9th
Run A Business Project Based Learning
This is a Project Based Learning activity that teaches students about running their very own business! It focuses on collaborative opportunities through hands-on experiences for students to engage in their learning. Students will create a business plan and follow through by running their business. Project Based Learning: Run A BusinessThis product includes differentiated activities, math skills, reading, research, writing, vocabulary, problem solving, aligned with Common Core, and extension acti
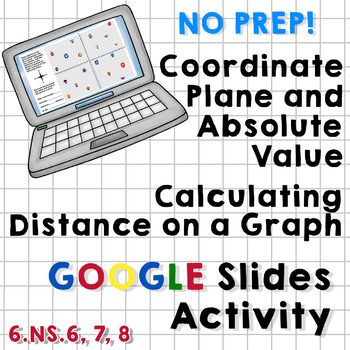
Coordinate Plane/Absolute Value/Distance on a Graph Google Slides Activity
This Google Slides Activity includes 14 slides containing basic reminders about the setup and use of a coordinate plane, calculating distance on a graph using absolute value, and describing directions as they relate to crossing over the axes.Students are asked to find the coordinates of several locations in "Grid Town" and then to describe the number of "city blocks" needed to travel to get from one destination to another. They are asked to use directional words (north/south/east/west) and dete
Function Fun, Unit 1: Patterns, T-tables, and Graphs
OVER 50 PAGES! These are the best strategies for teaching linear functions to all students. Tested in grades 4 through high school, this unit helps students develop competency with both the concepts and computations involved in functions. The multi-representational activities cover slope, y-intercept, t-tables, graphs, formulas, and visual representations of linear functions.This unit is part 1 of a four-part series and includes 17 patterns in both color and black and white versions to provide t
STEM Escape Room - PYRAMIDS of EGYPT
This STEM Escape Room Challenge is a set of five tasks for students to complete. There are a lot of different ways you can complete these five tasks. We do all five tasks over the course of a Friday afternoon in our classroom, or over a span of about 2 hours. You could also do these over the course of 2-3 class periods and students can pick up where they leave off each day. Student teams work at their own pace, they must complete the tasks in order and complete each task before they can move
Subjects:
Grades:
3rd - 7th
Types:
Decimals Project based learning Monster Ice Cream Parlor
Welcome to The Monster Ice Cream Parlor Decimal focused project-based learning! In this student-tested and approved project, students jump into ownership of the monster ice cream parlor. They create flavors, set prices, and graph their sales all while practicing adding, subtracting and multiplying decimals, and graphing. Included in this ready to use project:- Student pages for building a monster ice cream parlor- Student pages for calculating revenue- Student pages for graphing revenue and s
Subjects:
Grades:
4th - 6th
Types:
Also included in: 6th grade math MEGA resource bundle
Showing 1-24 of 195 results


