8 results
Graphing webquests for homeschool
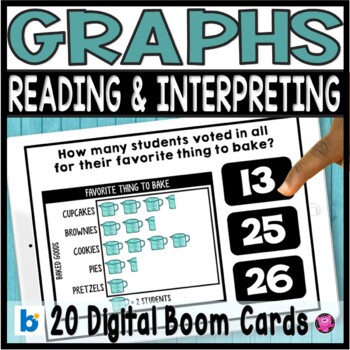
Reading Pictographs - Picture Graphs - Reading and Interpreting Data
These DIGITAL Picture Graphs are a super fun and interactive math activity for your 1st, 2nd, and 3rd grade students to practice reading, analyzing, and interpreting data! Students will answer use picture graphs, and bar graphs to answer questions like: most/least favorites, totals for each group, and compare, analyzing, and interpreting data. Boom Card can be used with Google Classroom, SeeSaw, ClassDoJo and other platforms. Click here to SAVE 20% on my Graphing Bundle!PLEASE NOTE YOU ARE PURCH
Subjects:
Grades:
1st - 3rd
Types:
Also included in: Kindergarten Math Worksheets Games and Centers YEAR-LONG BUNDLE
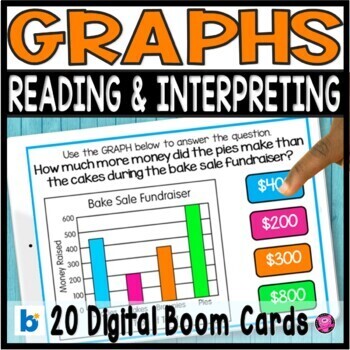
Bar Graphs and Picture Graphs Reading & Analyzing Data Digital Boom Cards
Teaching second and third grade students how to read and interpret data, solve one- and two-step "how many more" and "how many less" problems using information presented in scaled bar graphs will be fun and engaging using these 20 DIGITAL Boom math tasks! Students will practice common core 3.MD.B.3 graphing activities using multiple representations of graphs including data tables, bar graphs, line graphs, and pie graphs. The questions are differentiated for a wide range of learners.Click here to
Subjects:
Grades:
2nd - 3rd
Types:
Also included in: Graphing and Date Analysis Reading and Interpreting Graphs and Data

Webquest Investigation - Slope of a Line
Using a free online graphing calculator, students explore relationships between linear equations, their graphs, and the slopes of the lines. By the end of this investigation, students will discover relationships between parallel lines, perpendicular lines, and their slopes. Enjoy!
Subjects:
Grades:
7th - 11th, Adult Education
Types:
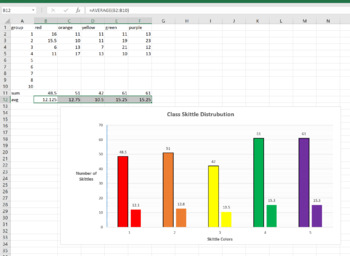
Skittle Statistics MS Excel Mini-Lab
This is a 1 class MS Excel lab for a computer or math class. You can have the students explore the distribution of different color Skittles in class. This is a great mini-lab or half-day activity when you school ends up with a weird schedule day. Tell them they can't eat till the Skittles till the end of class, or they will distort their numbers. Also make sure they don't throw them or shove them up their nose (Yes, stuck Skittles are hard to extract, ask me how I know..)The goal of this lab is
Grades:
6th - 12th, Higher Education, Adult Education
Types:
NGSS:
MS-ETS1-2
, HS-ETS1-2
, HS-ETS1-3
, MS-ETS1-4
, MS-ETS1-1
...
Also included in: Hands-on Science Semester Labs Bundle

Coordinate Plane Escape Room | Graphing Digital Breakout
Make your Coordinate Plane lessons more fun with with this engaging, digital escape room! This escape room includes 9 critical thinking and puzzle locks perfect for sharpening research skills and a never give up attitude. Quick and easy setup plus clear student directions make this activity perfect for individuals, groups, or even substitute days, too! Did I mention that this breakout is editable?!? Use as is, add, or subtract questions and then post the link through Google Classroom, a class w
Subjects:
Grades:
5th - 8th
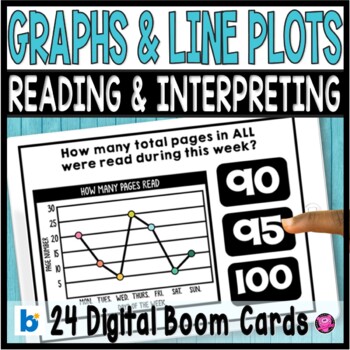
Graphing and Data - Bar Graphs Line Plots Pictographs 3rd Grade DIGITAL Tasks
Teaching your 3rd and 4th grade students how to read, interpret, and analyze dat data using bar graphs, line plots, and picture graphs will simple and easy using these 24 DIGITAL math tasks. Students will practice answering questions like: "how many more", "how many less", and "compare data" using line plots and pictographs. Boom Card can be used with Google Classroom, SeeSaw, ClassDoJo and other platforms. Click here to SAVE 20% on my Graphing Bundle!PLEASE NOTE YOU ARE PURCHASING A LINK TO ACC
Subjects:
Grades:
1st - 3rd
Types:
Also included in: Graphing and Date Analysis Reading and Interpreting Graphs and Data
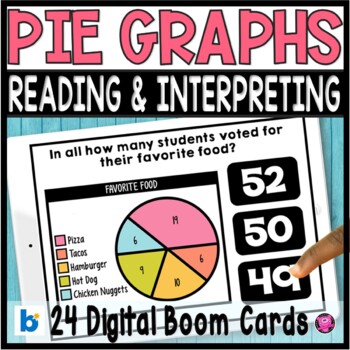
Pie Graphs Interpreting and Reading Data - Digital Boom Cards Pie Graphs
Teaching students how to read and interpret data, solve one- and two-step "how many more" and "how many less" problems using information presented in scaled bar graphs and pie graphs will be fun and engaging using these 24 DIGITAL Boom math tasks! Students will practice common core 3.MD.B.3 graphing activities using multiple representations of graphs including data tables, bar graphs, line graphs, and pie graphs. The questions are differentiated for a wide range of learnersClick here to SAVE 20%
Subjects:
Grades:
1st - 3rd
Types:
Also included in: Graphing and Date Analysis Reading and Interpreting Graphs and Data
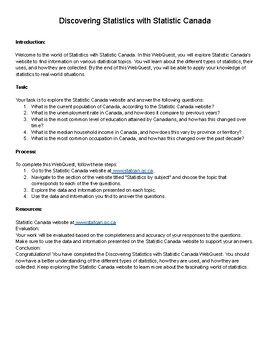
Discovering Statistics with Statistic Canada (WebQuest)
Welcome to the world of Statistics with Statistic Canada. In this WebQuest, you will explore Statistic Canada's website to find information on various statistical topics. You will learn about the different types of statistics, their uses, and how they are collected. By the end of this WebQuest, you will be able to apply your knowledge of statistics to real-world situations.
Grades:
7th - 12th, Staff
Types:
Showing 1-8 of 8 results


