114 results
Graphing simulations for staff and administrators
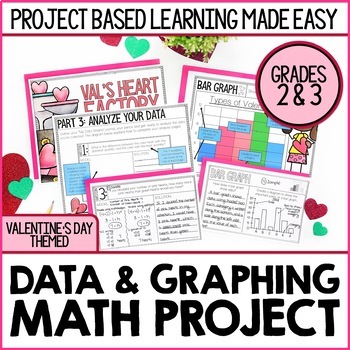
Valentine's Day Math Project | Conversation Hearts Graphing Lesson & Activity
This Valentine's Day-themed math project introduces your students to four methods for displaying data: Frequency TablesBar GraphsPictographsLine Plots Your students will record observations about each method for displaying data and compare/contrast methods for collecting data. Students will then use this knowledge to solve a problem for Val’s Heart Factory. Love this project idea, but planning to teach graphing at a different time of year? Sal's Sweet Factory will be a perfect fit for your class
Subjects:
Grades:
2nd - 3rd
Types:
Decimals Project based learning Monster Ice Cream Parlor
Welcome to The Monster Ice Cream Parlor Decimal focused project-based learning! In this student-tested and approved project, students jump into ownership of the monster ice cream parlor. They create flavors, set prices, and graph their sales all while practicing adding, subtracting and multiplying decimals, and graphing. Included in this ready to use project:- Student pages for building a monster ice cream parlor- Student pages for calculating revenue- Student pages for graphing revenue and s
Subjects:
Grades:
4th - 6th
Types:
Also included in: 6th grade math MEGA resource bundle
Line of Best Fit and Scatterplots
Who doesn't love a good mystery?!!!! In this engaging students use a real life scenario to apply scatterplot data of shoe size and height and the line of best fit to capture the correct suspect. This product has lots of great reviews! Many middle school math teachers state this was a great way to review the concept of line of best fit and scatterplots. Aligned to CCSSM8.SP.A.2 and CCSSM8.SP.A.3This activity is also available in a bundle at a discounted rate:Scatterplots and Line of Best
Subjects:
Grades:
7th - 9th
Types:
Also included in: Line of Best Fit and Scatterplots: The Bundle
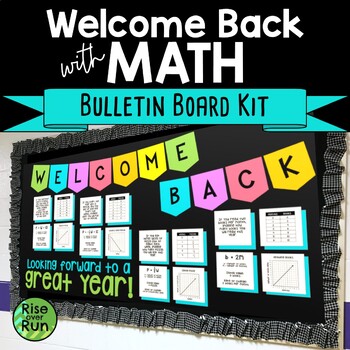
Math Bulletin Board Kit for Back to School
Welcome students with eye-catching math classroom decoration! This board will get students thinking about graphing and real world linear relationships in a fun way. Included are pennants to spell out “Welcome Back” and letters to spell out “Looking forward to a great year!” Four sets of linear functions are included. Each one has a story, an equation, a table of values, and a graph. This bulletin board would be perfect for a secondary math classroom or in a hallway. The math relates to math
Subjects:
Grades:
7th - 12th
Also included in: Math Bulletin Boards Bundle for All Year
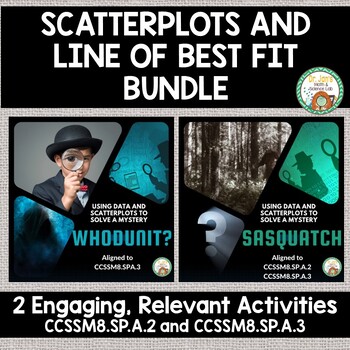
Line of Best Fit and Scatterplots: The Bundle
This bundle includes 2 engaging activities where students can apply the skills of plotting points in a scatterplot, making a line of best fit, and finding the slope of the line to find missing data. Fun scenarios of Sasquatch and a crime scene hook kids into learning. Please leave feedback, you can earn TpT credits for future purchases. If you enjoy these activities consider following my store as I work to increase my middle school math inventory. Check out my other middle school math produc
Subjects:
Grades:
7th - 9th
Types:
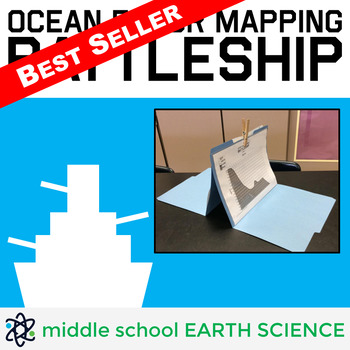
Ocean Floor Mapping Battleship Game
Teacher Review: "My students are obsessed with this activity! They even ask to play during indoor recess!" - Turner's Teaching Troop (January 22, 2020)Ocean Floor Mapping Battleship includes 36 unique maps of the ocean floor, a recording sheet, a detailed lesson plan with suggested pre-game activities, a blank map students can use to draw their own ocean floor, a diagram showing the layers of the ocean, and easy to follow game instructions. Field tested with sixth-graders, this game challenges s
Subjects:
Grades:
5th - 9th
Types:
CCSS:
Also included in: Earth Science Games Bundle
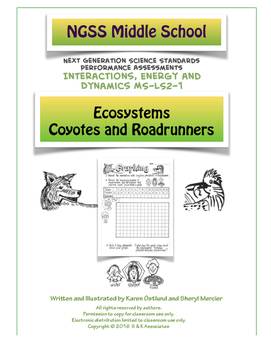
Ecosystems- Roadrunners and Coyotes NGSS Middle School LS2-1
Turn your students into an active ecosystem. This activity is similar to the classic Oh Deer simulation with a roadrunner and coyote twist. This sequence of NGSS aligned activities/assessments includes two simulation activities in which students are in the roles of a population of roadrunners, a predator (coyote), and resources (food, water, shelter). Students collect, graph, and analyze data to look for cause and effect relationships in an ecosystem. Reading and writing pages are included along
Subjects:
Grades:
5th - 7th
Types:
NGSS:
MS-LS2-1
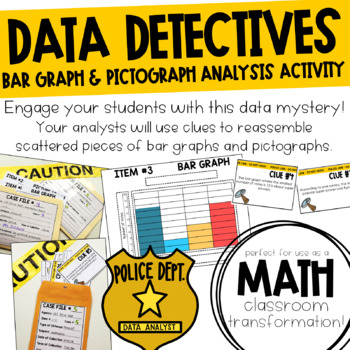
Data Detectives Bar Graph & Pictograph Mystery Activity
Engage your students with this data mystery! You left data in the classroom overnight and someone snuck in and completely scattered it. Oh no! In this activity, your students are data analysts who will use clues to reassemble the scattered pieces of bar graphs and pictographs.This product includes...4 graph starters for your students to complete (2 bar graphs, 2 pictographs)18 pieces (including some decoys) of graphs for your students to analyze and match to a graph starter8 cluesAND everything
Subjects:
Grades:
3rd - 4th
Types:
CCSS:
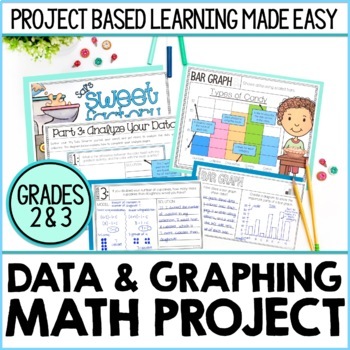
2nd & 3rd Grade Data and Graphing Math Project | Bar Graphs, Line Plots & More
This graphing math project introduces your students to four methods for displaying data: ★ Frequency Tables ★ Bar Graphs ★ Pictographs ★ Line Plots ★Your students will have the opportunity to record observations about each method for displaying data and compare/contrast methods for collecting data. They will then use this knowledge to solve a problem for Sal’s Sweet Factory. ***************************************************************************THE BIG PROBLEM YOUR STUDENTS WILL SOLVE:Sal's
Subjects:
Grades:
2nd - 3rd
Types:
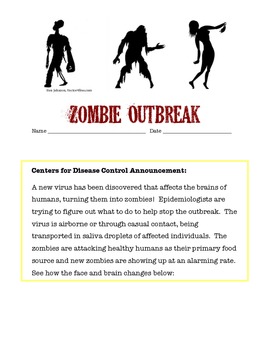
Investigating the Spread of a Viral Outbreak
Students in grades 5 - 9 model the spread of an infectious disease under the entertaining theme of a zombie outbreak. One student unknowingly is patient zero and students simulate the spread of an airborne illness. This highly engaging activity covers health topics, nature of science, and math skills as students graph data in a line plot. Higher level students can be challenged to find the function of the exponential growth of the outbreak.
Subjects:
Grades:
6th - 9th
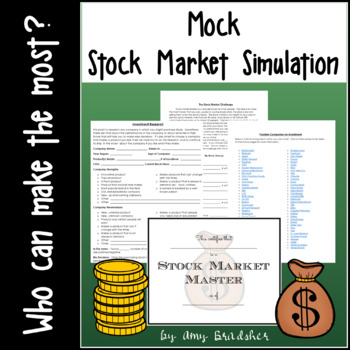
Stock Market Simulation Challenge I Digital Learning
What better way to understand how the stock market works than to simulate it in your classroom? To make it a competitive project! This simulation contains the project worksheets, hyperlinks, research guides, and graphs needed for your students to "purchase" their own stock and track it's value over time. This project was written to accompany Gary Paulsen's book "Lawn Boy," but it can be used with or without this book.These activities are suitable for upper-elementary and middle grade students
Subjects:
Grades:
5th - 7th
Types:
Scatterplots and Line of Best Fit
This engaging activity allows students to apply their knowledge of slope, scatterplot data, and line of best fit to figure out how tall Sasquatch is. Taking the role of engineers, students use a foot print of sasquatch to approximate his height which is needed to construct a trap. An engaging newspaper article sets the scene of the recent Sasquatch sightings at the local park. This activity is also available in a bundle at a discounted rate:Scatterplots and Line of Best Fit BundleAligned to C
Subjects:
Grades:
7th - 9th
Types:
Also included in: Line of Best Fit and Scatterplots: The Bundle
Project Based Learning: Starting a School Post Office
STEM Starting a School Post Office will introduce students to many important economics concepts as they start and run a School Post Office Simulation. Students learn how the post office runs and how their mail is delivered. This activity is a real live learning event! Students will love learning about economics as they start and run a post office!
Includes:
•Teachers Pages (4)
•Economic Concepts Page
•Student Objective Page
•Lesson Directions Pages (11)
•Pre-Assessment Prompt
•Design a Stam
Subjects:
Grades:
3rd - 5th
Types:
Also included in: Project Based Learning Bundle
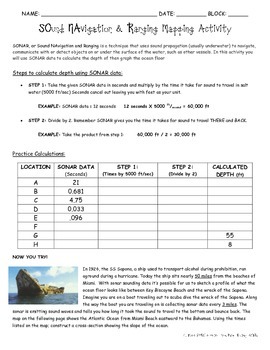
SONAR Calculations and Graphing
In this classroom activity, students are guided through the calculations necessary to obtain ocean depth from SONAR data. Then they use data to complete a profile of the part of ocean floor from which the data came. Please note: this does not show all the parts of the ocean floor. Image and activity where adapted from Naval History STEM H.
Subjects:
Grades:
6th - 12th
Types:
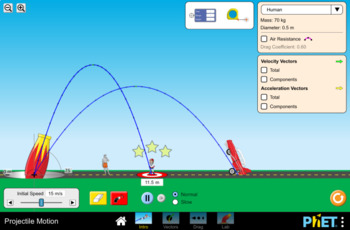
Projectile Motion Simulation Lab- PhET
This handout is meant to accompany the Projectile Motion simulation found here: https://phet.colorado.edu/en/simulation/projectile-motion
45 minute lesson time
This lab can be used to teach a range of concepts such as:
-Relationships between independent/manipulated and dependent/responding variables
-Forces in motion
-Projectile Motion
-The relationship between firing angle and distance traveled
-Graphing independent/ dependent variables
-Creating data tables
Subjects:
Grades:
6th - 12th, Higher Education, Adult Education
Types:
STEM Spacewalking Challenge Project Pack: Grades 2-5
STEM Spacewalking Challenge Project Packby Tiny Space AdventuresGet ready for some teamwork, higher level thinking, problem solving, engineering design and FUN, HANDS-ON LEARNING at its best!This lesson uses the STEM 5-E Instructional Method: Engage, Explore, Explain, Elaborate and Evaluate. Rubric includedStudents will:Create a replica of the spacesuit arm & gloveConduct astronaut hand physical training exercises and strength test.Fill out Astronaut Reports and graph results of strength te
Subjects:
Grades:
2nd - 5th
Types:
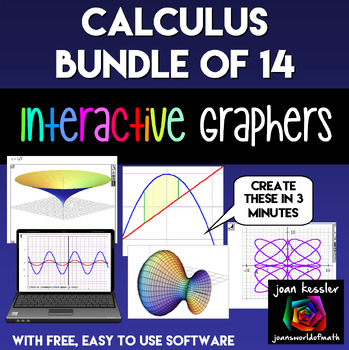
Calculus Bundle of Interactive Graphing Apps plus software
Your Calculus students will love these interactive simulations and demonstrations of graphical calculus. These Dynamic moving 3D graphs will help your Calculus students visualize the concepts you teach. Engaging and so easy to use, you will be demonstrating important concepts in AP Calculus AB, BC, Honors or traditional Calculus 1 and 2 in minutes. Project from your computer onto a screen or whiteboard. No internet needed.There are 14 Applets Included: ✓ Animated End Behavior ✓ Animated Functio
Grades:
11th - 12th, Higher Education
Types:
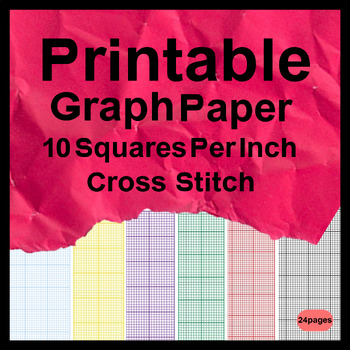
Printable Graph Paper 10 Squares Per Inch Cross Stitch
Printable Graph Paper 10 Squares Per Inch Cross Stitch - Grid paper is essentially the type of paper most commonly used for drawing and sketching purposes. It is widely used for making plan charts, designing websites, developing home ideas and so forth. A great deal of businesses who need to produce a company card, business brochures, catalogues, brochures, and so forth need this kind of graph paper.
Subjects:
Grades:
5th - 12th
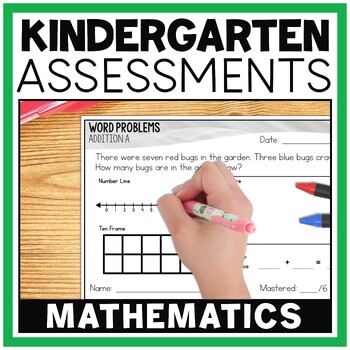
Kindergarten Math Assessments for the Year
Quality kindergarten math assessments are a must-have for your classroom! Throughout the year you will constantly be assessing your students. If you are looking for a quick and simple way to manage this task, Rapid Results half-page kindergarten math assessments are perfect for you! The kindergarten math assessments were developed to provide you with an easy way to test your students on concepts they are required to learn.How many assessments are included?There are 185 math assessments in your d
Subjects:
Grades:
K
Also included in: Kindergarten Beginning of the Year Assessments for Math and Literacy
INVESTING IN THE STOCK MARKET : an in-class simulation guide
This is a 29 page package to support teachers in running a 24 day stock market simulation in their grade 5-10 classroom. I have used a version of this in my class for several years now and the kids LOVE it! I have adjusted it and perfected it to include a 24 page student booklet, an evaluation sheet, and a three page SPECIFIC teacher instruction manual.
I offer this exact resource IN FRENCH. Check out La classe de Mme Geneviève for other Math Resources and French Immersion Resources.
Thank
Subjects:
Grades:
5th - 10th
Types:
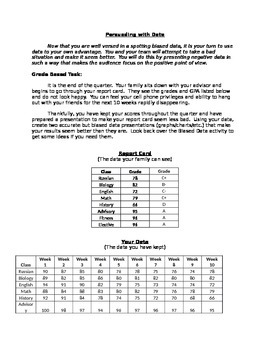
Persuading with Data: Using data bias to your advantage
The activity is designed as a follow-up to my Data Bias activity (posted for free). Student use what they learned about data bias to create data presentations (graphs, charts) that help prove their point. Multiple scenarios are given where students are trying to convince their parents that their grades/behavior aren't bad.
This activity helps students internalize the power of data bias and makes them more likely to look out for this bias in the real world. This makes for a really fun homew
Subjects:
Grades:
7th - 10th
Types:
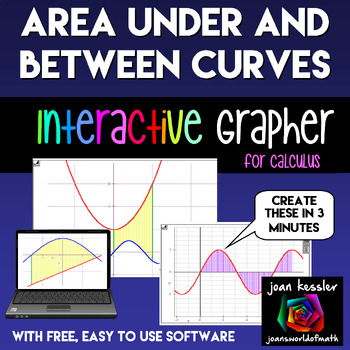
Calculus Area Under Curves Interactive Graphing Tool
Your Calculus students will love these interactive simulations and demonstrations of the Area Between Curves and the Area Under a Curve! These Dynamic moving 3-d graphs will help them visualize the concepts you teach. Engaging and so easy to use, you will be demonstrating important concepts in AP Calculus AB, BC, Honors or traditional Calculus 1 and 2 in minutes. Project from your computer onto a screen or whiteboard.Wow your Calculus students with interactive math explorations. Explore the a
Grades:
10th - 12th, Higher Education
Types:
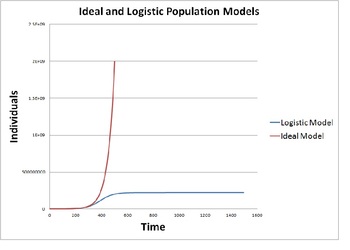
Modeling Population Growth (Ideal vs. Logistic Model)
This activity provides instructions to construct a mathematical model on a blank spreadsheet that simulates population growth using an ideal model and a logistic model. The activity provides background discussion and then gives instructions on how to program a spreadsheet to produce and display the ideal and logistic population models. Their results are studied for various cases including human population, rabbits, polar bears, bacterial and yeast colonies.
This quantitative population model
Subjects:
Grades:
9th - 12th, Staff
Types:
Simulation Classroom Economy Lesson Plan
This lesson plan is for a fifth or possible sixth grade economics unit. The lesson is specially designed to be a part of an economics unit which requires or needs a simulation. The lesson plan includes critical questions, currency template, simulation record sheet and step-by-step instructions on how to set up your classroom. This lesson plan will make your classroom economy simulation meaningful, integrated, value based, challenging and active (MIVCA).
Subjects:
Grades:
4th - 12th, Higher Education
Types:
Showing 1-24 of 114 results


