230+ results
Graphing simulations for parents
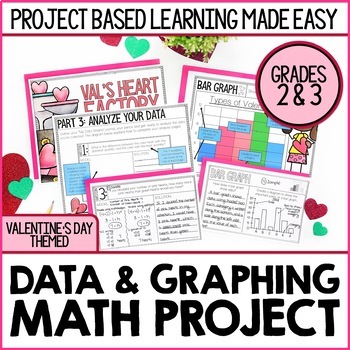
Valentine's Day Math Project | Conversation Hearts Graphing Lesson & Activity
This Valentine's Day-themed math project introduces your students to four methods for displaying data: Frequency TablesBar GraphsPictographsLine Plots Your students will record observations about each method for displaying data and compare/contrast methods for collecting data. Students will then use this knowledge to solve a problem for Val’s Heart Factory. Love this project idea, but planning to teach graphing at a different time of year? Sal's Sweet Factory will be a perfect fit for your class
Subjects:
Grades:
2nd - 3rd
Types:
Decimals Project based learning Monster Ice Cream Parlor
Welcome to The Monster Ice Cream Parlor Decimal focused project-based learning! In this student-tested and approved project, students jump into ownership of the monster ice cream parlor. They create flavors, set prices, and graph their sales all while practicing adding, subtracting and multiplying decimals, and graphing. Included in this ready to use project:- Student pages for building a monster ice cream parlor- Student pages for calculating revenue- Student pages for graphing revenue and s
Subjects:
Grades:
4th - 6th
Types:
Also included in: 6th grade math MEGA resource bundle

Line of Best Fit and Scatterplots
Who doesn't love a good mystery?!!!! In this engaging students use a real life scenario to apply scatterplot data of shoe size and height and the line of best fit to capture the correct suspect. This product has lots of great reviews! Many middle school math teachers state this was a great way to review the concept of line of best fit and scatterplots. Aligned to CCSSM8.SP.A.2 and CCSSM8.SP.A.3This activity is also available in a bundle at a discounted rate:Scatterplots and Line of Best
Subjects:
Grades:
7th - 9th
Types:
Also included in: Line of Best Fit and Scatterplots: The Bundle
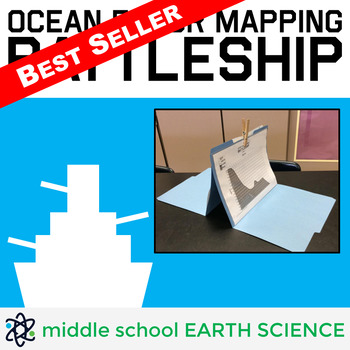
Ocean Floor Mapping Battleship Game
Teacher Review: "My students are obsessed with this activity! They even ask to play during indoor recess!" - Turner's Teaching Troop (January 22, 2020)Ocean Floor Mapping Battleship includes 36 unique maps of the ocean floor, a recording sheet, a detailed lesson plan with suggested pre-game activities, a blank map students can use to draw their own ocean floor, a diagram showing the layers of the ocean, and easy to follow game instructions. Field tested with sixth-graders, this game challenges s
Subjects:
Grades:
5th - 9th
Types:
CCSS:
Also included in: Earth Science Games Bundle
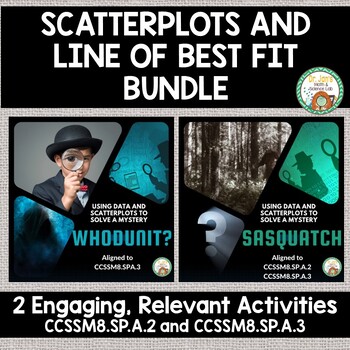
Line of Best Fit and Scatterplots: The Bundle
This bundle includes 2 engaging activities where students can apply the skills of plotting points in a scatterplot, making a line of best fit, and finding the slope of the line to find missing data. Fun scenarios of Sasquatch and a crime scene hook kids into learning. Please leave feedback, you can earn TpT credits for future purchases. If you enjoy these activities consider following my store as I work to increase my middle school math inventory. Check out my other middle school math produc
Subjects:
Grades:
7th - 9th
Types:
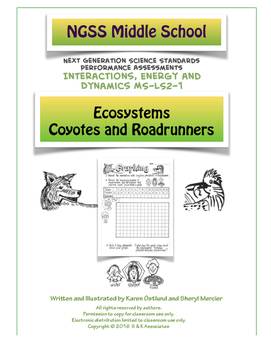
Ecosystems- Roadrunners and Coyotes NGSS Middle School LS2-1
Turn your students into an active ecosystem. This activity is similar to the classic Oh Deer simulation with a roadrunner and coyote twist. This sequence of NGSS aligned activities/assessments includes two simulation activities in which students are in the roles of a population of roadrunners, a predator (coyote), and resources (food, water, shelter). Students collect, graph, and analyze data to look for cause and effect relationships in an ecosystem. Reading and writing pages are included along
Subjects:
Grades:
5th - 7th
Types:
NGSS:
MS-LS2-1
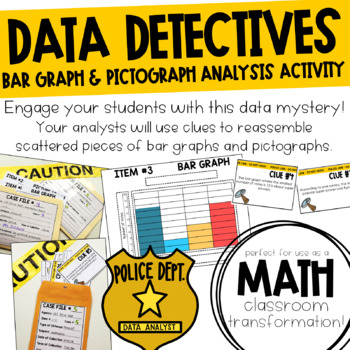
Data Detectives Bar Graph & Pictograph Mystery Activity
Engage your students with this data mystery! You left data in the classroom overnight and someone snuck in and completely scattered it. Oh no! In this activity, your students are data analysts who will use clues to reassemble the scattered pieces of bar graphs and pictographs.This product includes...4 graph starters for your students to complete (2 bar graphs, 2 pictographs)18 pieces (including some decoys) of graphs for your students to analyze and match to a graph starter8 cluesAND everything
Subjects:
Grades:
3rd - 4th
Types:
CCSS:

Data Collection Binder BUNDLE
Now, my BEST SELLING Data Binders/Folders are in ONE BUNDLE!
Some pages are editable in each binder! :o)
This bundle includes:
-Data Binder/Folder for Kindergarten
-Data Binder/Folder for First Grade
-Data Binder/Folder for Second Grade
Each data binder SUPPORTS Common Core!
Each data binder has a check list with Common Core that is grade specific.
Each has assessment tools, graphs, and goal setting charts.
This BUNDLE is great for teachers that teach multilevel grades k-2.
Instead of bu
Subjects:
Grades:
K - 2nd
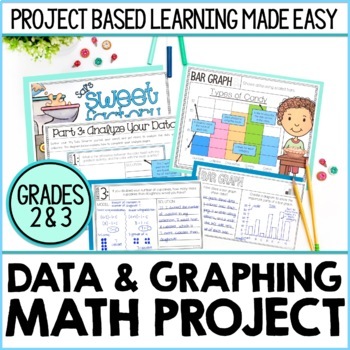
2nd & 3rd Grade Data and Graphing Math Project | Bar Graphs, Line Plots & More
This graphing math project introduces your students to four methods for displaying data: ★ Frequency Tables ★ Bar Graphs ★ Pictographs ★ Line Plots ★Your students will have the opportunity to record observations about each method for displaying data and compare/contrast methods for collecting data. They will then use this knowledge to solve a problem for Sal’s Sweet Factory. ***************************************************************************THE BIG PROBLEM YOUR STUDENTS WILL SOLVE:Sal's
Subjects:
Grades:
2nd - 3rd
Types:
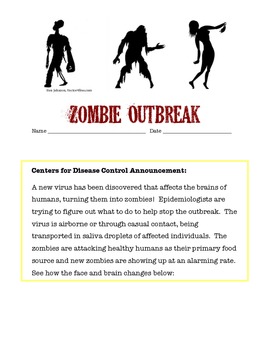
Investigating the Spread of a Viral Outbreak
Students in grades 5 - 9 model the spread of an infectious disease under the entertaining theme of a zombie outbreak. One student unknowingly is patient zero and students simulate the spread of an airborne illness. This highly engaging activity covers health topics, nature of science, and math skills as students graph data in a line plot. Higher level students can be challenged to find the function of the exponential growth of the outbreak.
Subjects:
Grades:
6th - 9th
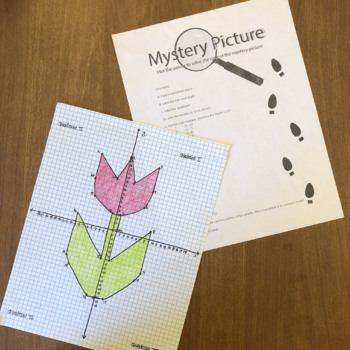
Mystery Picture Coordinate Plane- Flower
Students will plot points on a coordinate plane using both positive and negative points. They will then connect the points to create a picture. Students can color and decorate their mystery picture to make it their own. This is a great project to help students learn or practice how to plot on a coordinate plane. It is also a fun seasonal project that gives them a creative outlet. Teachers, this is also a great student project to display in your classroom.
Subjects:
Grades:
5th - 8th

Stock Market Simulation Challenge I Digital Learning
What better way to understand how the stock market works than to simulate it in your classroom? To make it a competitive project! This simulation contains the project worksheets, hyperlinks, research guides, and graphs needed for your students to "purchase" their own stock and track it's value over time. This project was written to accompany Gary Paulsen's book "Lawn Boy," but it can be used with or without this book.These activities are suitable for upper-elementary and middle grade students
Subjects:
Grades:
5th - 7th
Types:
Scatterplots and Line of Best Fit
This engaging activity allows students to apply their knowledge of slope, scatterplot data, and line of best fit to figure out how tall Sasquatch is. Taking the role of engineers, students use a foot print of sasquatch to approximate his height which is needed to construct a trap. An engaging newspaper article sets the scene of the recent Sasquatch sightings at the local park. This activity is also available in a bundle at a discounted rate:Scatterplots and Line of Best Fit BundleAligned to C
Subjects:
Grades:
7th - 9th
Types:
Also included in: Line of Best Fit and Scatterplots: The Bundle
Project Based Learning: Starting a School Post Office
STEM Starting a School Post Office will introduce students to many important economics concepts as they start and run a School Post Office Simulation. Students learn how the post office runs and how their mail is delivered. This activity is a real live learning event! Students will love learning about economics as they start and run a post office!
Includes:
•Teachers Pages (4)
•Economic Concepts Page
•Student Objective Page
•Lesson Directions Pages (11)
•Pre-Assessment Prompt
•Design a Stam
Subjects:
Grades:
3rd - 5th
Types:
Also included in: Project Based Learning Bundle
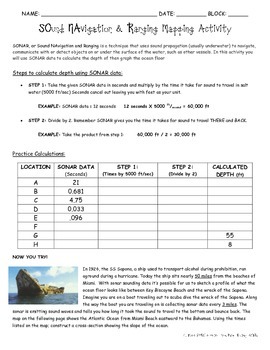
SONAR Calculations and Graphing
In this classroom activity, students are guided through the calculations necessary to obtain ocean depth from SONAR data. Then they use data to complete a profile of the part of ocean floor from which the data came. Please note: this does not show all the parts of the ocean floor. Image and activity where adapted from Naval History STEM H.
Subjects:
Grades:
6th - 12th
Types:

Vacation Homework Journal
This Vacation Journal packet is the perfect solution for the "homework" request from families as they prepare to leave on a family vacation. This fun journal will allow students to practice writing skills while recording their memories of their special time with family. The packet is designed for K-5, with primary and upper elementary writing line options. There are writing activities for pre, during and post vacation. Students may also rate each day, record weather on a graph, and compile/ex
Subjects:
Grades:
K - 3rd
Types:
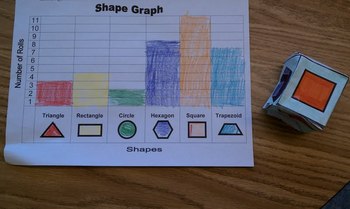
Shape Graph and Shape Identification
This interactive project includes a shape cube template. First, students should color the shapes and cut out the template. Then, students fold the template to make a cube (use tape to keep it together). Once students have their shape cube, they can roll the cube and start filling in the the shape graph.
As students roll, they will match the picture to the graph, which includes a picture and words. This repetative exposure will help students identify and name the shape. This can be a partner
Grades:
PreK - 2nd
Types:
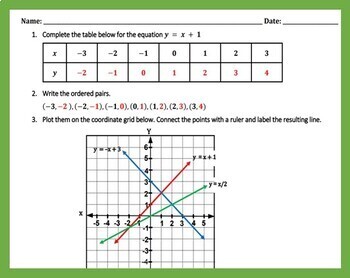
Bundle-Graphing Linear Equations with Tables of Values Worksheets I, II, & III
This is a bundle for: Graphing Linear Equations with Tables of Values Worksheet I Graphing Linear Equations with Tables of Values Worksheet II Graphing Linear Equations with Tables of Values Worksheet IIIFor more practice please refer to Graphing Linear Equations with Table of Values Worksheet IV
Grades:
4th - 8th
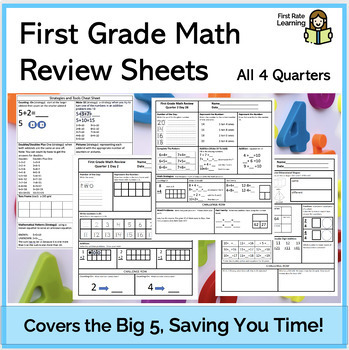
Quarters 1-4 Standards Based Daily Spiral Math Review (Morning Work/Bell Work)
Your first graders will thrive with these spiraling morning work printable. Focusing on equations w/ sums less than 10, this packet includes Written Numbers, Number Sense, Counting-On, Doubles, Fact Family, Missing Addends, Partners for 10, Count-On to Subtract, and Word Problems. You will also find challenge problems for those needing a little more.Quarter 1Focus on equations with sums less than 10Week 1-Count-On to AddWeek 2-DoublesWeek 3-Fact FamilyWeek 4-Missing AddendsWeek 5-Partners for 10
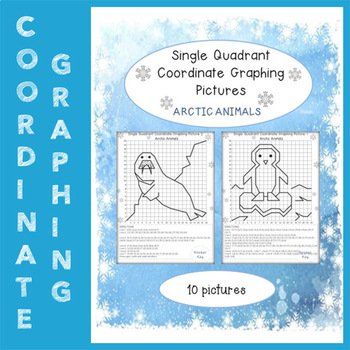
Arctic Animals. Have Fun with Mystery Pictures! -Single Quadrant Coordinate Pics
(Single Quadrant Coordinate Graphing Pictures)10 mystery pictures!Arctic animals included:- Walrus - Blue whale- Arctic fox- Polar bear- Arctic owl- Arctic hare- Puffin- Caribou- Orca- Penguin (Penguins DO NOT live in the Arctic. They actually live in the Antarctic. But I decided to include them as well).A completed answer key page for every picture is included.All points are represented by positive whole numbers, there are no fractions or decimals. Great activity for anytime of the year!
Subjects:
Grades:
1st - 9th
Types:
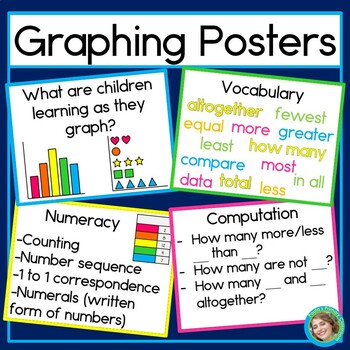
Graphing Posters | Bulletin Board Display | Interpreting Graphs
Use these posters to help parents understand why you do class graphs! Display them your graphs to encourage parents to talk about math concepts and vocabulary with their children, or to start math conversations in class. Here's what other educators are saying about this resource:"Integrates concepts with basic math terminology. Good Job!""This is an awesome resource. Thank you""This helps with doing a lesson plan to know what to teach."Click here to be notified when new resources are released a
Subjects:
Grades:
PreK - 1st
Types:
CCSS:
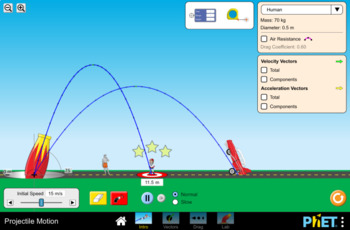
Projectile Motion Simulation Lab- PhET
This handout is meant to accompany the Projectile Motion simulation found here: https://phet.colorado.edu/en/simulation/projectile-motion
45 minute lesson time
This lab can be used to teach a range of concepts such as:
-Relationships between independent/manipulated and dependent/responding variables
-Forces in motion
-Projectile Motion
-The relationship between firing angle and distance traveled
-Graphing independent/ dependent variables
-Creating data tables
Subjects:
Grades:
6th - 12th, Higher Education, Adult Education
Types:
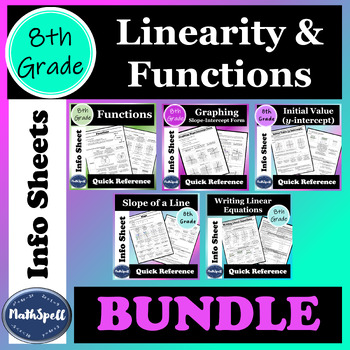
Linearity & Functions | Quick Reference Sheets | 8th Grade Math Review | BUNDLE
Great way to help students quickly review linearity and functions! These 8th Grade Math Cheat Sheets can be used for students to review concepts they've already learned (great for end of year reviews), or as complete notes pages to help teach the concepts. These sheets are also helpful for parents and substitute teachers as a way to refresh their memory of a concept so they're better able to help students.More 8th Grade Math Reference Sheets available in my store as a larger BUNDLE (for a discou
Grades:
8th - 9th
Types:
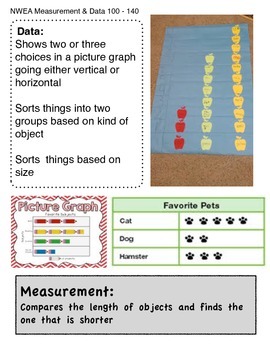
NWEA Measurement and Data
NWEA RIT scores 100 - 200
These pages will help both the teacher and parents prepare students to tackle NWEA testing. The pages are written in parent friendly language with examples and vocabulary necessary for children to know and understand.
As my students prepare to take NWEA testing I use these pages to teach needed skills based on each child's RIT score. I also send the page home that coordinates to each child's score so parents can work with their child on the needed skills. Both teache
Subjects:
Grades:
K - 3rd
Types:
Showing 1-24 of 230+ results


