122 results
Higher education graphing resources for Microsoft Word
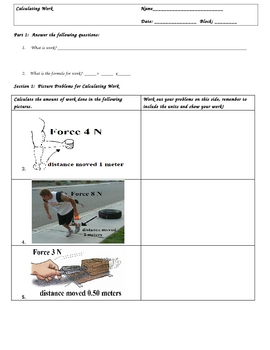
Calculating Work (W=Fxd) Worksheets and Key
Calculating Work (W=Fxd) Worksheets and KeyIf you have been teaching a Simple Machines or Energy Unit, then you need to check out this three page lesson to teach calculating work. It is in three sections.Section 1: Picture QuestionsSection 2: Word Problems/with Challenge QuestionsSection 3: Charting/Graphing ProblemsAll problems are worked out and the key is included.These worksheets include the renown Triangle Method, which has been a proven problem solver for students who struggle in math.The
Subjects:
Grades:
3rd - 12th, Higher Education, Adult Education
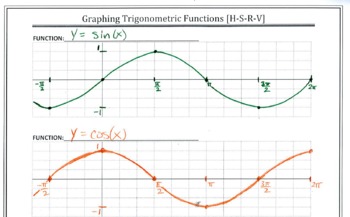
Graph Paper for Trig Functions
This changes everything! Student work becomes more consistent. Your grading will be so much easier! Using the four aligned graphs makes translations of trig functions crystal clear. This file has 2 pages of coordinate planes for graphing trig functions.The first page contains four blank graphs per page. The axes are unlabeled so that students may select their own scale.The second page has five blank graphs per page and is set up for conducting transformations on the coordinate plane.Please see
Subjects:
Grades:
10th - 12th, Higher Education, Adult Education
Interpreting Graphs and Charts
Students work with a variety of 25 graphs and charts and learn how to interpret the information provided. The format varies from one to the other: pie, column bar, horizontal bar, line/dot, and picture (volcano) graphs and table charts. Appropriate for math, Social Studies, ELA, ESL, and Spanish culture. Can be used in Gr. 6-12, adult education, college, and home school. All answer keys provided.
Grades:
6th - 11th, Higher Education, Adult Education
Types:
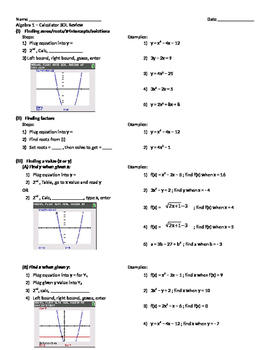
Algebra 1 Calculator Review (TI-84)
Comprehensive review of all graphing calculator concepts taught through the Algebra 1 course. Review concepts include finding roots, factors, values (x or y), y-intercept, mean, standard deviation, line/curve of best fit, and finding solutions to systems of equations. The review include steps and screenshots of the calculator.
Subjects:
Grades:
7th - 12th, Higher Education, Adult Education
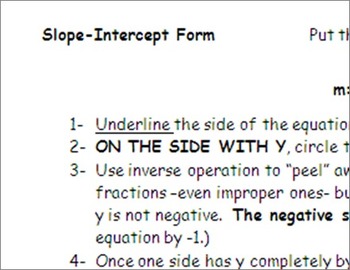
Slope-Intercept Form: Solving for Y
I could NEVER find enough practice on this skill, so I made my own! Hopefully, you will find it as resourceful as I did (and do.)This activity includes 18 equations to place in slope-intercept form. It features a thorough task analysis that takes students through each step of isolating y. To build confidence, the first six equations allow students to solve for y in only one move. The remaining problems involve two or more moves. There are some equations that include fractions and simplifyi
Grades:
8th - 9th, Higher Education, Adult Education
Types:
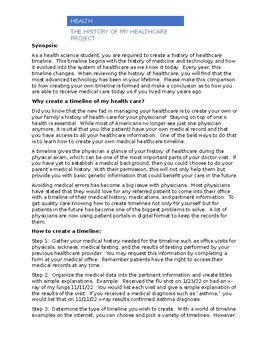
History of Health Care - My Timeline
Critical Thinking with application of Math using graphics is all in this lesson! Learning how to create a medical timeline is essential for healthcare in today's world. Designing a timeline for the history of healthcare is described in this lesson, however this lesson is designed to allow students to create their own (with parent permission) or to create a "mock design" of a medical timeline may work better for classroom use. This will show the "new" way of presenting medical history to your p
Grades:
9th - 12th, Higher Education, Adult Education, Staff

Question Exploration: What Are the Solar Activity Sunspot Cycles?
What are the solar activity sunspot cycles? Sunspots increase and decrease through an average cycle of 11 years. This Question Exploration helps Ss explain how the spotless Sun turns dark, releasing solar flares and coronal mass ejections (CMEs).Question Exploration Routine is an instructional methods that teachers can use to help a diverse student population understand a body of content information by carefully answering a critical question to arrive at a main idea answer. The Concept Comparis
Subjects:
Grades:
7th - 12th, Higher Education
Types:
NGSS:
HS-ESS1-1
Geometry Test Bundle
Need Geometry unit tests? Study guides? 60-minute group work? Preparation for SAT, PARCC, or other CCSS-aligned state exams? Look no further! This bundle includes TEN 25-question-long tests, most of which have 20 multiple choice and 5 short response or extended constructed response questions. All tests have an answer key included. Topics covered range pretty much the full year of a standard to advanced high school CCSS Geometry course, and major topics include:
- Definitions of Key Geometry Conc
Subjects:
Grades:
8th - 12th, Higher Education
Types:

The Great Gatsby: Social Issue Research Project
This project involves students researching real-life social issues that appear in The Great Gatsby and connecting them with the novel. It incorporates MANY ELA Common Core State Standards, including reading non-fiction articles, relating the text to real life, presenting information orally by utilizing visual aids, creating charts and grafts to represent knowledge learned, etc.
This product includes the project description and rubric. It could be done with any thematic piece of literature. I h
Subjects:
Grades:
7th - 12th, Higher Education
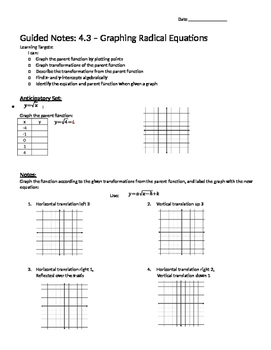
Graphing Square and Cube Root Functions - Notes
Guided notes teaching how to graph square root and cube root functions by translating the parent function. I teach my students to use the "base points" [ (0, 0), (1, 1), and (4, 2) or (-1, -1) for square/cube root] and then transform them using (h, k) or vertex form. They also must be able to determine transformations and equations from a graph. The notes are a summation of the whole unit so they must graph equations at the end and also find the domain/range as well as find x- and y-intercepts a
Subjects:
Grades:
9th - 12th, Higher Education, Adult Education
Types:
6 Editable Bar Graph Templates 2.0
Finally a simple and professional graph space that students can fill out without any design issues getting in the way. This file contains 6 ready-to-use graph options. Print them and have students fill them with pencil and ruler, or distribute them over computer and let them practice entering the data. Get a project perfect finish every time. Maybe you just want to fill it out live on a projector? The possibilities are endless! It's okay to say you love these bar graphs. So do we.Contains:- 2 bl
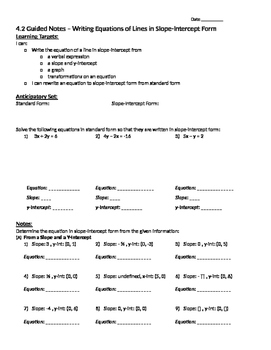
Writing Equations in Slope-Intercept Form - Notes
Guided notes teaching students how to write equations in slope-intercept form when given a graph, a slope and a y-intercept, and a verbal explanation. The notes also teach how to transform equations in slope-intercept form when given vertical shifts and "stretches" in the steepness/flatness of the line. The beginning of the notes also reviews how to find the slope-intercept form of an equation written in standard form by solving for y. I also have a corresponding assignment of the same name.
Grades:
7th - 12th, Higher Education, Adult Education
Types:
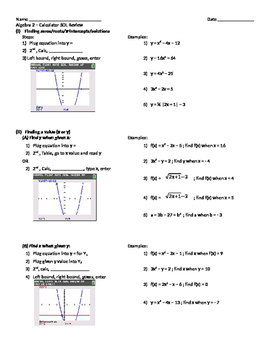
Algebra 2 Calculator Review (TI-84)
Comprehensive review of all graphing calculator concepts taught through the Algebra 2 course. Review concepts include finding roots,values (x or y), mean, standard deviation, line/curve of best fit, minimums/maximums, intervals of increase/decrease, domain and range, and finding solutions to systems of equations. The review includes steps and screenshots of the calculator.
Subjects:
Grades:
9th - 12th, Higher Education, Adult Education
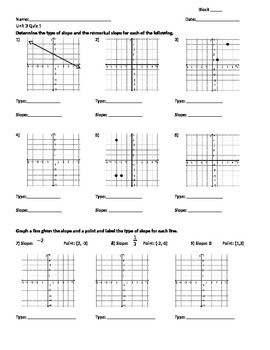
Graphing Linear Equations and Inequalities in Slope-Intercept Form - Quiz
Unit quiz testing the ability to determine the slope of a line, graph given a point and a slope, graph given an equation in slope-intercept form, and graph given an inequality in slope-intercept form. Students must describe the verbal type of slope (positive, negative, zero, undefined) as must be able to determine points in the solution set and not in the solution set. This unit quiz corresponds to my notes and assignments of similar names.
Grades:
7th - 12th, Higher Education, Adult Education
Types:
Transformations Word Search
Transformations Word Search
23 words to find about Transformations
You may also be interested in my other top-selling products:
EQUIVALENT FRACTIONS (33 Items)
Fractions 10 Pages of Practice (191 questions)
Fractions Review and Reinforcement
Fractions Test (15 Q)
4th Grade Word Problems Quiz (10 Q)
Equations and Inequalities Quiz (20 Questions)
Evaluate Expressions Quiz (22 questions)
Pairs of Lines Quiz (17Q)
Decimals, Fractions and Percents Quiz (10 Q)
Order of Operations Quiz
Grades:
3rd - 12th, Higher Education, Adult Education, Staff
Types:
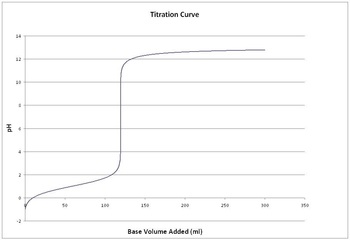
Simulating Titration of Acid on a Spreadsheet
This activity guides students to construct a spreadsheet from a blank Excel workbook that will simulate titration of acids or bases.
*Teacher background on Excel is not required*
After constructing the spreadsheet and graphs the students will experiment with the spreadsheet to answer analysis questions that will help students learn the mathematical nature of titration (solutions are provided including descriptions of all spreadsheet manipulations necessary to solve each problem).
The va
Subjects:
Grades:
10th - 12th, Higher Education
Types:
Graph Paper 16
This is a free sample of graph paper in Word format. Simply print out the page, or use it onscreen with an interactive whiteboard. This particular graph is 14x14, with subgrids equaling 28x28. It is one of 30 graph papers included in Graphs Grids & Games, a digital document by John Rice available on TeachersPayTeachers.com
Grades:
PreK - 12th, Higher Education, Adult Education
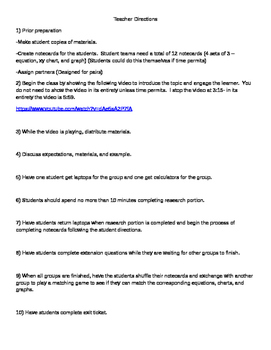
Graphing Linear Equations Project/Graphing Using Rates
This is a fantastic math project that gives students an opportunity to learn about trains around the world. Students work in pairs to research the speeds of different trains. They will write an equation in y=mx format, create an x/y chart, and graph the equation for each train. The results can then be used to play a matching game when groups switch their cards. Students will then have to match equations, charts, and graphs. This project also comes with a student-created rubric, grading chec
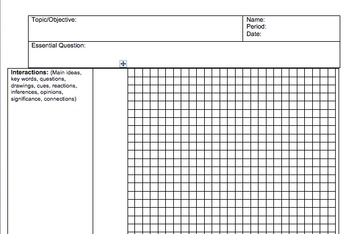
Cornell Notes for Graphing - Math/Science (editable)
Similar in design to my free Cornell Notes template, this template includes 2 pages for graphing and taking notes on it. The right side of both pages is graph paper with room for labels and increments and the left side is room for notes and prompts for students to reflect on their graphs. The document is compatible with word and able to be edited to reflect specific needs you may have.
Grades:
3rd - 12th, Higher Education, Adult Education
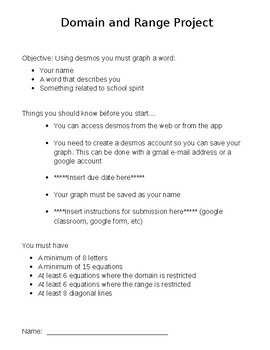
Domain and Range Graphing Project
Students must create the graph of a word using lines and by restricting the domain and range of the lines. This is done digitally through Desmos which allows students to save their progress on the graphs. It helps them understand the concepts of domain and range more in depth and how a graph is affected by manipulating the equation or the domain and range.
A grading rubric is provided.
Subjects:
Grades:
9th - 12th, Higher Education
Types:
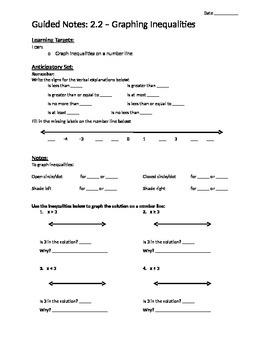
Graphing Inequalities on a Number Line - Notes
Notes teaching students how to go to/from an algebraic inequality to/from a verbal expression to/from a graph on a number line. The notes also contain examples of finding numbers that are in and not in the solution set from the graph, the verbal expression, and the algebraic inequality. The beginning also contains a review of the verbal expressions used to represent less than, greater than or equal to, at most, no less than, etc. I also have a corresponding assignment of the same name.
Grades:
7th - 12th, Higher Education, Adult Education
Types:
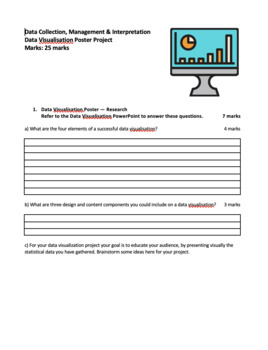
Data Visualisation Poster Project Booklet
This Data Visualisation Poster Project is one of the most successful ways to make boring spreadsheets fun and engaging! It includes questions and step-by-step tasks on research, planning, designing and producing the poster, with recommended marks. It includes links to free software recommendations for producing the poster. It also includes a rubric for the design and producing section.Students will need an introduction to spreadsheets in order to complete the poster project.Best used in conjunct
Grades:
6th - 10th, Higher Education
Types:
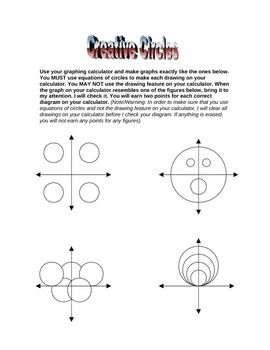
Equation of a Circle Fun & Creative Activity
This is a fun and interesting activity for students to demonstrate their knowledge of an equation of a circle. This activity can be used in both a Geometry and Algebra 2 class, and it uses the TI-83 graphing calculator. Students are given several different recognizable figures composed of circles, and their task is to figure out the correct equations of the circles, solve them for y, and enter them into the graphing calculator. There are many different answers, but the activity is self-assessing
Subjects:
Grades:
9th - 12th, Higher Education, Adult Education
Types:
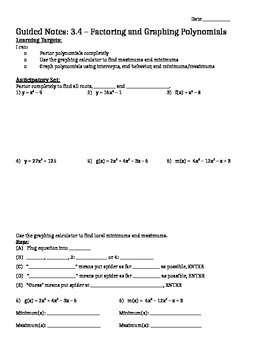
Factoring and Graphing Polynomials in Standard Form - Notes
Guided notes teaching how to graph polynomials in standard form using the end behavior, algebraically found x-intercepts by factoring, y-intercept and the reflection of the y-intercept, and the minimums/maximums found on the graphing calculator. Emphasis is on non-calculator based solving, and only using the calculator to find local min/max. I also have a corresponding assignment of the same name.
Subjects:
Grades:
9th - 12th, Higher Education, Adult Education
Types:
Showing 1-24 of 122 results


