93 results
Higher education graphing resources for Microsoft PowerPoint

Desmos Graphing Project (Review)
This project is meant as a review of linear functions as well as transformations in the coordinate plane (translations, reflections, rotations, dilations). Students get to choose which transformation to perform, so it does not "review all transformations". Students use Desmos to outline a letter, usually an initial, (restricting domain and range) and then transform it within Desmos (in a table). For easier projects: pick transformations for students to perform (translations, dilations) and walk
Grades:
8th - 12th, Higher Education, Adult Education
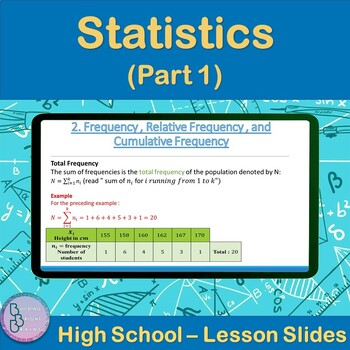
Statistics Part 1 | High School Math PowerPoint Lesson Slides
Are you teaching your High School students about Statistics? Plenty of examples and application exercises are included. You can also easily convert this to a Google Slides lesson by dragging it into your Google Drive.What is included?✦ 30 total slides for notes, examples and applications.✦ All steps are animated to allow the teacher to explain them gradually. Throughout the Lesson, students will be introduced to the following:✦ Statistics Vocabulary✦ Frequency , Relative Frequency , and Cumulati
Subjects:
Grades:
10th - 12th, Higher Education
Histograms and Frequency Tables (Powerpoint) for Busy Teachers
This powerpoint presentation introduces the concept of histograms and frequency tables.
Clipart, sounds, and animation are used sparingly and effectively to help illustrate points without being distracting. This powerpoint presentation has been extensively refined using faculty AND student input and feedback.
Definitions of histogram, interval, frequency table, and frequency are all presented. The progression from a frequency table to a completed histogram is illustrated and animated using
Subjects:
Grades:
4th - 12th, Higher Education, Adult Education
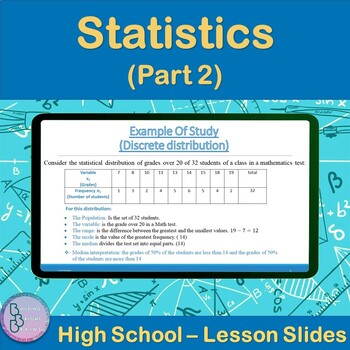
Statistics Part 2 | High School Math PowerPoint Lesson Slides
Are you teaching your High School students about Statistics (Part 2)? Plenty of examples and application exercises are included. You can also easily convert this to a Google Slides lesson by dragging it into your Google Drive.What is included?✦ 18 total slides for notes, examples and applications.✦ All steps are animated to allow the teacher to explain them gradually. Throughout the Lesson, students will be introduced to the following:✦ Statistical Vocabulary✦ Discrete distribution✦ Continuous d
Subjects:
Grades:
10th - 12th, Higher Education

Rio Olympics 2016 Medal Tally
This is designed to engage and excited students in the Rio Olympics for 2016, use this medal tally to track your country or other countries medal count.
Grades:
PreK - 12th, Higher Education, Adult Education, Staff
Types:

Systems of Equations and Inequalities- jeopardy style game
This is a game based on the jeopardy game show idea and it includes the following topics:
1_ Solving Systems of Linear Equations by Graphing, Elimination and Substitution Methods
2_Solving Systems of Linear Inequalities
3_Solving Systems of Equations in 3 variables by Elimination or Substitution
Playing a game before a test, is usually a very exciting time for my students, they love playing a game right before a test. After a few years of using this practice, it seems that this type of review g
Subjects:
Grades:
7th - 11th, Higher Education, Adult Education
BUNDLE: Functions and Relations Power Point with Corresponding Lab/ NO PREP
Students find the following lesson and corresponding activity to be an exhilarating mathematical experience!* Why?* They find it exhilarating, because after going through the lesson and the accompanying activity, they readily understand a simple but confusing concept. * The power point includes a 39 page power point over Functions and Relations along with a 19 page Math Lab written by yours truly. * The Math Lab provides "hands-on" experience to students where they use a pair of
Subjects:
Grades:
6th - 9th, Higher Education, Adult Education
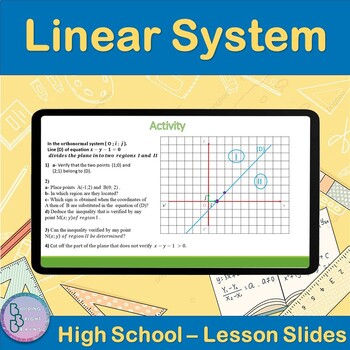
Linear System | High School Math PowerPoint Lesson Slides
Are you teaching your High School students about Linear System? Plenty of examples and application exercises are included. You can also easily convert this to a Google Slides lesson by dragging it into your Google Drive.What is included?✦ 17 total slides for notes, examples and applications.✦ All steps are animated to allow the teacher to explain them gradually. Throughout the Lesson, students will be introduced to the following:✦ Algebraic method of solving✦ Substitution Method ✦ Comparison Met
Grades:
10th - 12th, Higher Education
Algebra Power-Point: The Coordinate Plane with GUIDED NOTES/DISTANCE LEARNING
I am very excited to share with you my power point on The Coordinate Plane. ^ This forty-seven page presentation brings students into a whole new realm of mathematics where algebra and geometry meet for the first time in the world of numbers. * I have included a bit of history trivia as to how the coordinate plane arrived with its name, "The Cartesian Plane," and an interesting tid-bit about it's creator. * From there, the lesson discusses the origin, x-axis, y-axis, ordered pairs
Grades:
6th - 10th, Higher Education, Adult Education
CCSS:
Also included in: BUNDLE: Algebra Power-point Graphing Linear Equations and Functions
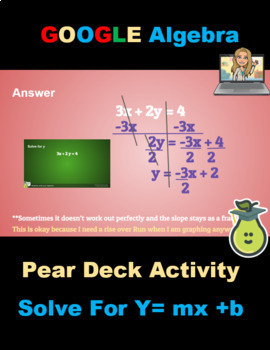
Pear Deck Solve For Y= MX +B Linear Equation Slope Intercept Form Algebra
Solve for y = mx + b from standard form in this Pear Deck Activity that can be independent or student paced.- A problem is presented- The answer and explanation is on the next page for review or discussion- Many types of examples are embedded within
Grades:
6th - 12th, Higher Education
Types:
Also included in: Pear Deck Algebra 1 Summer School Google Activity Bundle NO PREP Digital

Data Representation Powerpoint
The presentation contains: 1) TALLY MARKS Learning Objectives. Definition of a tally mark. Uses of tally mark. How to count a tally mark. Tally Mark Chart. Construction of a tally mark table with an example. Application on real life problems on tally mark. Read and Interpret a tally mark table.The presentation contains: 2) FREQUENCY DISTRIBUTION TABLEDefinition of a Frequency Distribution Table. Types of Frequency Distribution Table: a) Discrete Frequency Distribution Table (Ungrouped).b) C
Subjects:
Grades:
1st - 10th, Higher Education, Staff
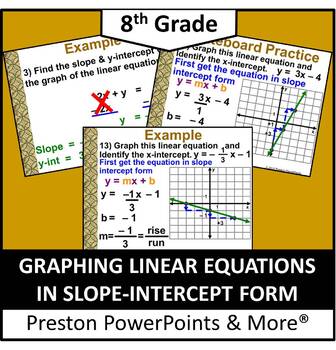
(8th) Graphing Linear Equations in Slope-Intercept Form in a PowerPoint
8th Grade Math (Pre-Algebra) Graphing Linear Equations in Slope-Intercept Form in a PowerPoint PresentationThis slideshow lesson is very animated with a flow-through technique. I developed the lesson for my 8th grade class, but it can also be used for upper level class reviews. This lesson teaches how to find slopes and y-intercepts of graphs of linear equations and graph linear equations written in slope-intercept form.This lesson has SKELETON NOTES, notes that have the problem only. I used t
Grades:
7th - 9th, Higher Education
CCSS:

Algebra Power-point: Solving Quadratic Equations by Graphing with GUIDED NOTES
The following lesson covers "Solving Quadratic Equations by Graphing".
* Students begin by reviewing Standard Form for a Quadratic Equation
* Students learn where to locate the solutions to a Quadratic Equation on the Cartesian Plane.
* Students learn three inter-changeable ways to refer to the solutions to a Quadratic Equation.
* Students learn the steps necessary to find the solutions of a Quadratic Equation
* Students learn and explain in their own words what the graph of a Quadra
Subjects:
Grades:
8th - 11th, Higher Education, Adult Education
Algebra Power Point: Graphing Inequalities in Two Variables with GUIDED NOTES
With the greatest of enthusiasm, I share my most recent power point with you on "Graphing Inequalities in Two Variables".
* The lesson begins with a review showing ordered pairs as solutions to inequalities.
* Step by step, students move into graphing inequalities of vertical and horizontal lines.
* They review the meaning of boundaries, half-planes, and how to test for the solution half-plane.
* Progressing, they graph inequalities in two variables using slope-intercept
Subjects:
Grades:
7th - 12th, Higher Education, Adult Education
CCSS:
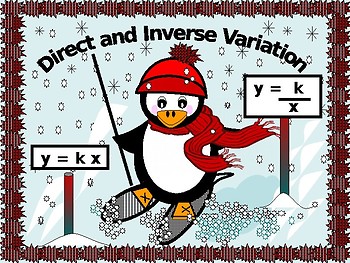
Algebra Power point: Direct and Inverse Variation with GUIDED NOTES/NO PREP
This lesson is an extension of the lesson on proportions, preparing students for the upcoming lessons over Rational Expressions.* Students learn the difference between Direct Variation functions and Inverse Variation functions.* Students receive a clear understanding as to the difference between the two types of functions.* Students learn the models for both direct and inverse variation* Students are introduced to the "Constant of Variation"* Students learn the steps used to write an equat
Subjects:
Grades:
7th - 11th, Higher Education, Adult Education
CCSS:

BUNDLE: Algebra PP Solving and Graphing Linear Inequalities/DISTANCE LEARNING
I am delighted to present my BUNDLE of power points covering all required material on "Solving and Graphing Linear Inequalities." * The complete bundle is 290 pages and the $31.50value has been reduced to $26.75, a savings of nearly 16%! * The lessons include the following topics: Solving Inequalities Using Addition and Subtraction, Solving Inequalities Using Multiplication or Division, Solving Multi-Step Inequalities, Solving Compound Inequalities Involving "AND", Solving Compound
Subjects:
Grades:
7th - 11th, Higher Education, Adult Education
Basic Differentiation Bundle
This is a superb 3 LESSON bundle on different aspects of Basic Differentiation. Each lesson comes with superb slides as well as activities, questions and worksheet.This bundle includes the following lessons:Lesson 1 - Introduction and BasicsLesson 2 - Gradients, tangents and Gradient FunctionsLesson 3 - 2nd Differential, Stationary or Turning PointsALL LESSONS for teaching all the different topics of ALGEBRA are available as one BIG BUNDLE in the link below:Algebra: ALL LessonsALSO:1. Please pro
Subjects:
Grades:
9th - 12th, Higher Education

Introduction to Data Visualization
This presentation introduces key concepts and considerations in data visualization, including:the history of data visualizationan introduction to the benefits and importance of data visualization types of visualizationshow to choose a visualization typedata visualization design principles and best practicesleading data visualization platforms the differences between raster and vector graphicskey considerations when thinking about creating a visualization Use this as part of a unit on graphing, d
Subjects:
Grades:
6th - 12th, Higher Education, Adult Education, Staff
Also included in: Graphic Design Growing Bundle
BUNDLE: Algebra Power point Systems of Linear Equations and Inequalities
I am extremely excited to share my bundled package power point lessons all about Systems of Linear Equations and Inequalities! * The 210 slides include the following topics covered in detail: -Graphing Linear Systems, Solving Linear Systems by Substitution -Solving Linear Systems by Linear Combinations, Special Types of Linear Systems -Systems of Inequalities. * Each of the lessons include clear and complete explanations, step by step, as to how to solve for
Subjects:
Grades:
7th - 11th, Higher Education, Adult Education
CCSS:
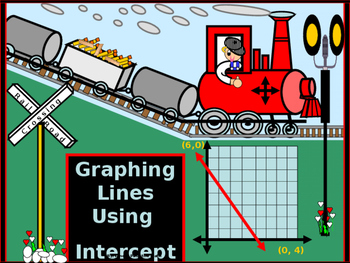
Algebra PP: Graphing Lines using the Intercepts/DISTANCE LEARNING/ NO PREP
At this point in any students' experience of learning to graph linear equations, they are beginning to notice that there are multiple variations available to them in order to graph a linear equation.
* They learn to graph a linear equation by finding the x and y intercepts.
* They learn to 'scale' their graph to fit comfortably, as needed, on the x and y axis.
* They are also provided with an example in a real life situation; they use the intercepts to graph an equation and
Grades:
6th - 10th, Higher Education, Adult Education
CCSS:
Also included in: BUNDLE: Algebra Power-point Graphing Linear Equations and Functions
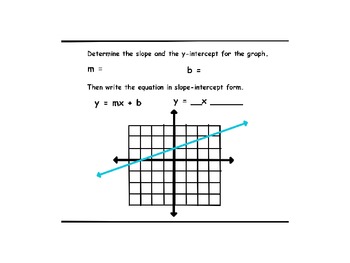
Writing Equations in Slope Intercept Form
Essential Question: When given the graph of a line, can you write the equation in slope-intercept form?
This Power Point lesson walks students through 4 different lines and then gives the graphs of seven more lines that students can work on when they are displayed on a whiteboard or Smart Board.
Subjects:
Grades:
7th - 12th, Higher Education, Adult Education
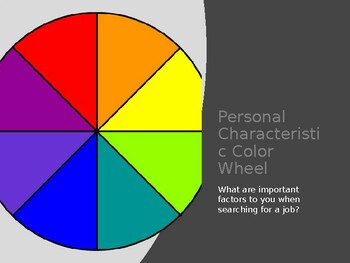
Personal Characteristic Wheel: Job Search Important Factors (PPT/WS/Graphing)
What are important factors when searching for a job? Students will evaluate 8 important factors which might be of high importance to an applicant. The 8 factors will be clearly defined so students may make a personal decision based on their needs as an employee. Students will then take their results and be guided by the PowerPoint to create an online graph. Each part of creating the graph is clearly guided. Students will then submit their graph to their teacher. A hardcopy worksheet of the gr
Grades:
9th - 12th, Higher Education, Adult Education
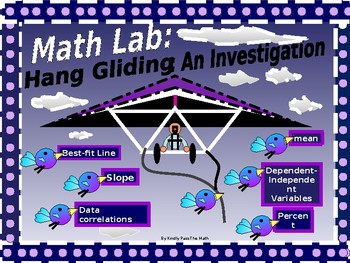
Math Lab An Algebra Review Via Hands-on Glider Investigation
Please join me in my enthusiasm for Math Lab Investigating Gliders!The lab is a two day event that covers and reviews multiple concepts covered in Algebra I, semesters I and II* It is outstanding for bringing concepts back to students prior to finals and for assisting them in applying mathematics to real life situations.* This 50 page investigation requires the student to address the relationship between the wing-span of a glider and the distance that it can fly.* On day one, students work in
Subjects:
Grades:
7th - 12th, Higher Education, Adult Education
Types:
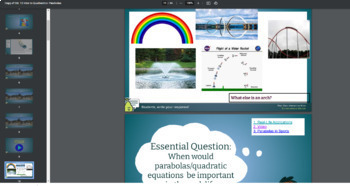
Introduction Exploratory to properties of Quadratic Parabola Slides / Peardeck
A fun exploratory way to introduce quadratics! Many visuals, practice and ways to think outside the box with these slides! A class lesson to get down the characteristics of the parabola
Subjects:
Grades:
7th - 12th, Higher Education, Adult Education
CCSS:
Showing 1-24 of 93 results


