270 results
Higher education graphing microsofts
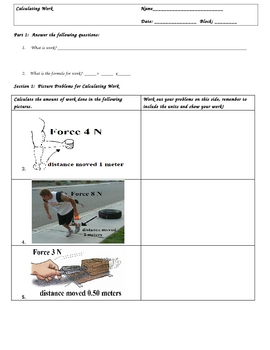
Calculating Work (W=Fxd) Worksheets and Key
Calculating Work (W=Fxd) Worksheets and KeyIf you have been teaching a Simple Machines or Energy Unit, then you need to check out this three page lesson to teach calculating work. It is in three sections.Section 1: Picture QuestionsSection 2: Word Problems/with Challenge QuestionsSection 3: Charting/Graphing ProblemsAll problems are worked out and the key is included.These worksheets include the renown Triangle Method, which has been a proven problem solver for students who struggle in math.The
Subjects:
Grades:
3rd - 12th, Higher Education, Adult Education
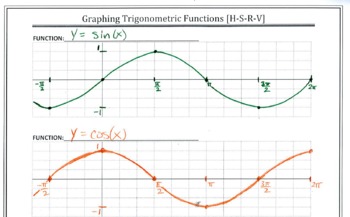
Graph Paper for Trig Functions
This changes everything! Student work becomes more consistent. Your grading will be so much easier! Using the four aligned graphs makes translations of trig functions crystal clear. This file has 2 pages of coordinate planes for graphing trig functions.The first page contains four blank graphs per page. The axes are unlabeled so that students may select their own scale.The second page has five blank graphs per page and is set up for conducting transformations on the coordinate plane.Please see
Subjects:
Grades:
10th - 12th, Higher Education, Adult Education
Interpreting Graphs and Charts
Students work with a variety of 25 graphs and charts and learn how to interpret the information provided. The format varies from one to the other: pie, column bar, horizontal bar, line/dot, and picture (volcano) graphs and table charts. Appropriate for math, Social Studies, ELA, ESL, and Spanish culture. Can be used in Gr. 6-12, adult education, college, and home school. All answer keys provided.
Grades:
6th - 11th, Higher Education, Adult Education
Types:
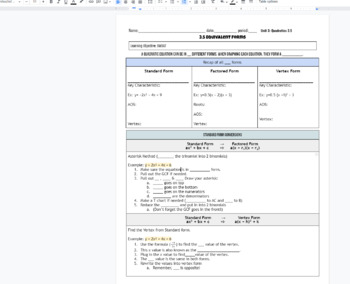
Converting between 3 forms of quadratic equations (equivalent functions) notes
Unit 3: 3.5 Converting between 3 forms of quadratic equations (equivalent functions) notes. In these scaffolded notes / graphic organizers students convert between standard, factored, and vertex form quadratic equations. The notes are broken up to show the steps on how to go from one to another. This also tells how a parabola can look like 3 different equations.Doc is editable. KEY is included in title and at the bottom of the doc. math 2 HS class. (see 3.1, 3.2, 3.3, 3.4 for previous notes!)
Subjects:
Grades:
7th - 12th, Higher Education, Adult Education
CCSS:
Also included in: Quadratic Forms & Characteristics Unit Notes & Homework
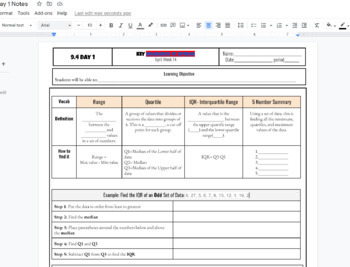
IQR interquartile Range and 5 number summary box and whisker plot Notes
IQR interquartile Range and 5 number summary box and whisker plot Notes including Q1, Q2, Q3, Min and Max and step by step both examples of finding the IQR and creating a box and whisker plot. Used in HS math 1 class WITH KEY INCLUDED AS a link to a printable PDF
Subjects:
Grades:
7th - 12th, Higher Education, Adult Education
CCSS:

Desmos Graphing Project (Review)
This project is meant as a review of linear functions as well as transformations in the coordinate plane (translations, reflections, rotations, dilations). Students get to choose which transformation to perform, so it does not "review all transformations". Students use Desmos to outline a letter, usually an initial, (restricting domain and range) and then transform it within Desmos (in a table). For easier projects: pick transformations for students to perform (translations, dilations) and walk
Grades:
8th - 12th, Higher Education, Adult Education
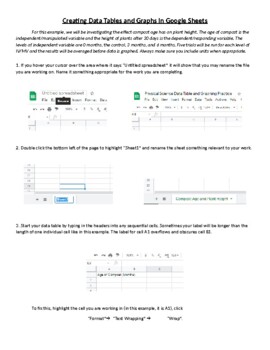
Creating Data Tables and Graphs in Google Sheets
This is an activity that walks students through the process of organizing and entering data into a data table and then using that data to generate line, bar, and pie charts. Once the graphs are generated, the process of formatting and editing the different parts of each graph is explained.

Parabola Transformations - Interactive
A handy guide to help new students learn how each change affects the shape and direction of parabolas. Clear color coding for the various pieces of the formula and instant updates help separate and isolate the concepts for easy, intuitive learning.Enter information using simple dropdown menus and organized blank fields to isolate each piece of the formula!Two tabs:One allows you to enter individual pieces of information to show the resulting formulaOne allows you to enter the formula to show the
Subjects:
Grades:
7th - 12th, Higher Education, Adult Education
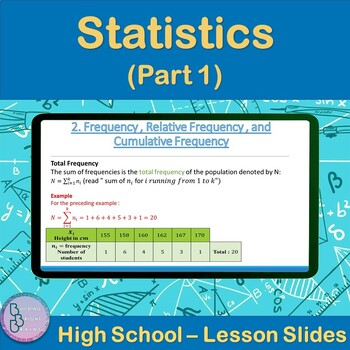
Statistics Part 1 | High School Math PowerPoint Lesson Slides
Are you teaching your High School students about Statistics? Plenty of examples and application exercises are included. You can also easily convert this to a Google Slides lesson by dragging it into your Google Drive.What is included?✦ 30 total slides for notes, examples and applications.✦ All steps are animated to allow the teacher to explain them gradually. Throughout the Lesson, students will be introduced to the following:✦ Statistics Vocabulary✦ Frequency , Relative Frequency , and Cumulati
Subjects:
Grades:
10th - 12th, Higher Education
Histograms and Frequency Tables (Powerpoint) for Busy Teachers
This powerpoint presentation introduces the concept of histograms and frequency tables.
Clipart, sounds, and animation are used sparingly and effectively to help illustrate points without being distracting. This powerpoint presentation has been extensively refined using faculty AND student input and feedback.
Definitions of histogram, interval, frequency table, and frequency are all presented. The progression from a frequency table to a completed histogram is illustrated and animated using
Subjects:
Grades:
4th - 12th, Higher Education, Adult Education
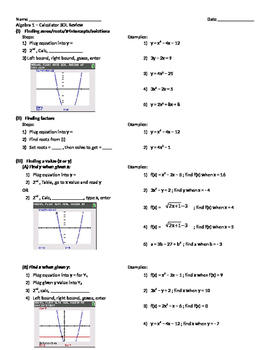
Algebra 1 Calculator Review (TI-84)
Comprehensive review of all graphing calculator concepts taught through the Algebra 1 course. Review concepts include finding roots, factors, values (x or y), y-intercept, mean, standard deviation, line/curve of best fit, and finding solutions to systems of equations. The review include steps and screenshots of the calculator.
Subjects:
Grades:
7th - 12th, Higher Education, Adult Education
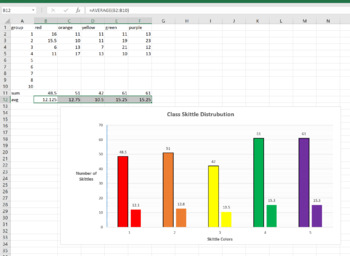
Skittle Statistics MS Excel Mini-Lab
This is a 1 class MS Excel lab for a computer or math class. You can have the students explore the distribution of different color Skittles in class. This is a great mini-lab or half-day activity when you school ends up with a weird schedule day. Tell them they can't eat till the Skittles till the end of class, or they will distort their numbers. Also make sure they don't throw them or shove them up their nose (Yes, stuck Skittles are hard to extract, ask me how I know..)The goal of this lab is
Grades:
6th - 12th, Higher Education, Adult Education
Types:
NGSS:
MS-ETS1-2
, HS-ETS1-2
, HS-ETS1-3
, MS-ETS1-4
, MS-ETS1-1
...
Also included in: Hands-on Science Semester Labs Bundle
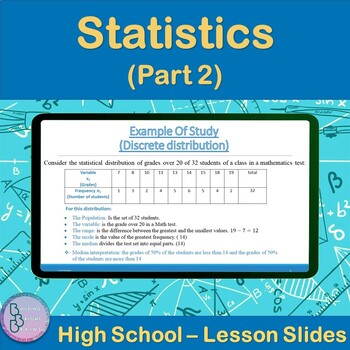
Statistics Part 2 | High School Math PowerPoint Lesson Slides
Are you teaching your High School students about Statistics (Part 2)? Plenty of examples and application exercises are included. You can also easily convert this to a Google Slides lesson by dragging it into your Google Drive.What is included?✦ 18 total slides for notes, examples and applications.✦ All steps are animated to allow the teacher to explain them gradually. Throughout the Lesson, students will be introduced to the following:✦ Statistical Vocabulary✦ Discrete distribution✦ Continuous d
Subjects:
Grades:
10th - 12th, Higher Education

Rio Olympics 2016 Medal Tally
This is designed to engage and excited students in the Rio Olympics for 2016, use this medal tally to track your country or other countries medal count.
Grades:
PreK - 12th, Higher Education, Adult Education, Staff
Types:

Systems of Equations and Inequalities- jeopardy style game
This is a game based on the jeopardy game show idea and it includes the following topics:
1_ Solving Systems of Linear Equations by Graphing, Elimination and Substitution Methods
2_Solving Systems of Linear Inequalities
3_Solving Systems of Equations in 3 variables by Elimination or Substitution
Playing a game before a test, is usually a very exciting time for my students, they love playing a game right before a test. After a few years of using this practice, it seems that this type of review g
Subjects:
Grades:
7th - 11th, Higher Education, Adult Education
BUNDLE: Functions and Relations Power Point with Corresponding Lab/ NO PREP
Students find the following lesson and corresponding activity to be an exhilarating mathematical experience!* Why?* They find it exhilarating, because after going through the lesson and the accompanying activity, they readily understand a simple but confusing concept. * The power point includes a 39 page power point over Functions and Relations along with a 19 page Math Lab written by yours truly. * The Math Lab provides "hands-on" experience to students where they use a pair of
Subjects:
Grades:
6th - 9th, Higher Education, Adult Education
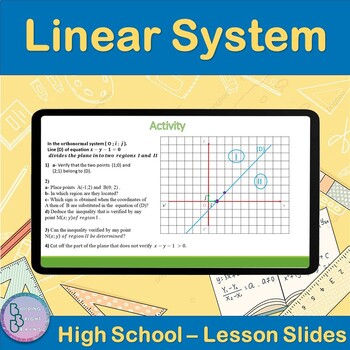
Linear System | High School Math PowerPoint Lesson Slides
Are you teaching your High School students about Linear System? Plenty of examples and application exercises are included. You can also easily convert this to a Google Slides lesson by dragging it into your Google Drive.What is included?✦ 17 total slides for notes, examples and applications.✦ All steps are animated to allow the teacher to explain them gradually. Throughout the Lesson, students will be introduced to the following:✦ Algebraic method of solving✦ Substitution Method ✦ Comparison Met
Grades:
10th - 12th, Higher Education
Algebra Power-Point: The Coordinate Plane with GUIDED NOTES/DISTANCE LEARNING
I am very excited to share with you my power point on The Coordinate Plane. ^ This forty-seven page presentation brings students into a whole new realm of mathematics where algebra and geometry meet for the first time in the world of numbers. * I have included a bit of history trivia as to how the coordinate plane arrived with its name, "The Cartesian Plane," and an interesting tid-bit about it's creator. * From there, the lesson discusses the origin, x-axis, y-axis, ordered pairs
Grades:
6th - 10th, Higher Education, Adult Education
CCSS:
Also included in: BUNDLE: Algebra Power-point Graphing Linear Equations and Functions
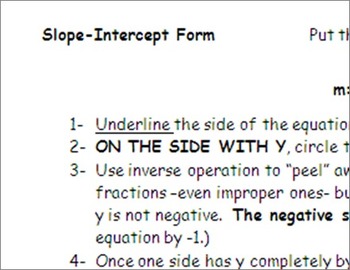
Slope-Intercept Form: Solving for Y
I could NEVER find enough practice on this skill, so I made my own! Hopefully, you will find it as resourceful as I did (and do.)This activity includes 18 equations to place in slope-intercept form. It features a thorough task analysis that takes students through each step of isolating y. To build confidence, the first six equations allow students to solve for y in only one move. The remaining problems involve two or more moves. There are some equations that include fractions and simplifyi
Grades:
8th - 9th, Higher Education, Adult Education
Types:
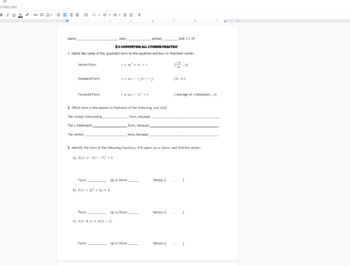
All 3 Forms of Quadratic Equations (converting) practice worksheet or test
3.5 is all 3 forms of converting between standard, factored and vertex forms of quadratic equations. This is the practice from 3.5 notes in my store. This is on a google doc and editable. The key is included in the title liked as a pdf and also linked at the bottom of the doc. Used in HS math 2 class. This can be used as a test, assessment, homework, or worksheet.
Subjects:
Grades:
7th - 12th, Higher Education, Adult Education
Types:
CCSS:
Also included in: Quadratic Forms & Characteristics Unit Notes & Homework
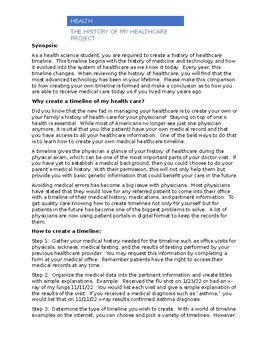
History of Health Care - My Timeline
Critical Thinking with application of Math using graphics is all in this lesson! Learning how to create a medical timeline is essential for healthcare in today's world. Designing a timeline for the history of healthcare is described in this lesson, however this lesson is designed to allow students to create their own (with parent permission) or to create a "mock design" of a medical timeline may work better for classroom use. This will show the "new" way of presenting medical history to your p
Grades:
9th - 12th, Higher Education, Adult Education, Staff

Question Exploration: What Are the Solar Activity Sunspot Cycles?
What are the solar activity sunspot cycles? Sunspots increase and decrease through an average cycle of 11 years. This Question Exploration helps Ss explain how the spotless Sun turns dark, releasing solar flares and coronal mass ejections (CMEs).Question Exploration Routine is an instructional methods that teachers can use to help a diverse student population understand a body of content information by carefully answering a critical question to arrive at a main idea answer. The Concept Comparis
Subjects:
Grades:
7th - 12th, Higher Education
Types:
NGSS:
HS-ESS1-1
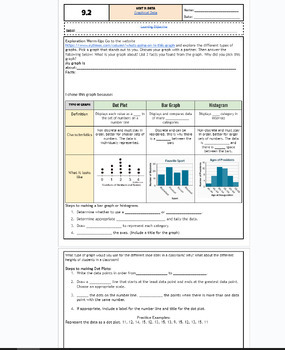
Graphical Data: Bar Charts, Dot Plots and Histograms fillable notes UPDTD
Unit 9: Data and Stats: UpdatedUpdated9.2 Graphs: bar, dot plot, histpgramStudents go over the vocabulary and define each type fo graph and what data fits for each graph. The warm up is an exploratory activity where students go on a website to search for their graph of interest and discuss the key findings. This takes around 10-15 mins and students enjoyed it! Notes are scaffolded. Includes hook video hyperlinked on the "learning objective" title. Key is included and hyperlinked as a PDF in the
Subjects:
Grades:
6th - 12th, Higher Education, Adult Education
CCSS:
Also included in: Unit 9: Data and Statistics Fillable Notes
Geometry Test Bundle
Need Geometry unit tests? Study guides? 60-minute group work? Preparation for SAT, PARCC, or other CCSS-aligned state exams? Look no further! This bundle includes TEN 25-question-long tests, most of which have 20 multiple choice and 5 short response or extended constructed response questions. All tests have an answer key included. Topics covered range pretty much the full year of a standard to advanced high school CCSS Geometry course, and major topics include:
- Definitions of Key Geometry Conc
Subjects:
Grades:
8th - 12th, Higher Education
Types:
Showing 1-24 of 270 results


