17 results
Free graphing resources for Microsoft Publisher
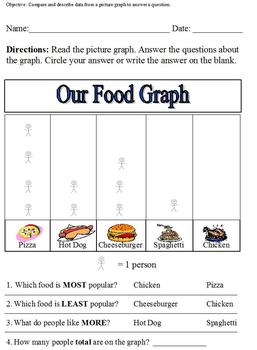
Food Picture Graph; Compare and Describe Data in a Graph
This is modified for sixth grade special ed, statistics. Students will read the graph and answer the questions. This can also be used in primary grades.
Subjects:
Grades:
1st - 6th
Types:

Kindergarten Graphing Activity
Students will read a story problem about a student that surveys her class and collects data on each student's favorite ice cream flavor. Students will use the data in the story to create a graph.
Subjects:
Grades:
K - 1st
Types:
Fruit Loop Math
Here are three worksheets that you can use to graph Fruit Loops! My students loved it and they get a snack at the end:) I hope you enjoy it as well!
Grades:
1st - 3rd
Types:
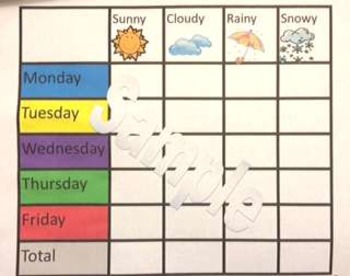
simple weather graph
This is a simple weather graph/chart the has the days for the school week Monday-Friday and a place to record the weather (sunny, cloudy, rainy, or snowy) for each day. There is also a row to record the totals for each type of weather for the week. It can be printed as a worksheet or projected on a whiteboard for morning circle/meeting time. There are circles that can be dragged to record the weather on the chart if projecting.
Subjects:
Grades:
PreK - 2nd

Slope : Rise over Run Poster
This is a poster that I use in my class. Nothing fancy just something I've always used and wanted to share. The poster is a publisher file.
Subjects:
Grades:
7th - 12th
Types:
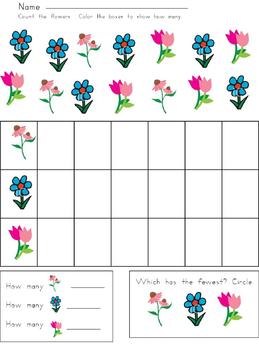
Flowers Graphing Practice Sheet
This is graphing sheet using flower clip art that can be used for center or job work during math time.
Subjects:
Grades:
PreK - 1st
Types:

Plan A Vacation in Indiana
This project can be adapted to meet the social studies standards of other states, but is created for the state of Indiana. Students choose a vacation destination as well as two historical stops in Indiana. They plan their trip using many resources including brochures, mapquest, their text book, and more! This project incorporates social studies, health, math, reading, and writing standards! The final product will be a scrapbook created by each student that hightlights the important parts of In
Subjects:
Grades:
3rd - 5th
Types:
Maths Grids - 5x5 Grids - 6 on a page
Grids that can be used for many different mathematical applications - Matrices, Data Collection, Mapping, Instruction Following.
Subjects:
Grades:
1st - 12th
Types:

Weather graph for journals
This is a weekly weather graph and fill in the blank for the students to fill out each week. I attach these in my students math/ science journals and they fill them out at the beginning of each morning.
Subjects:
Grades:
PreK - 3rd
Types:

Journal Weather graph
This is a weekly weather graph and fill in the blank for the students to fill out each week. I attach these in my students math/ science journals and they fill them out at the beginning of each morning.
Subjects:
Grades:
PreK - 3rd
Types:

Frequency Table Activity
Easy frequency table dice activity that I created for my 3rd graders. They loved it!
Subjects:
Grades:
2nd - 4th
Types:
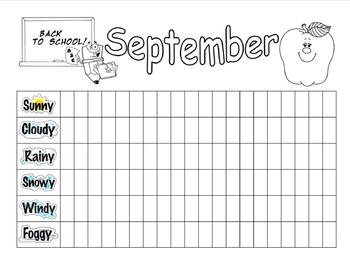
Weather Graph - September
September Weather Graph - sunny, cloudy, rainy, snowy, windy, foggy.
Publisher file can be changed to use for any month of the year.
Subjects:
Grades:
PreK - 3rd
Types:

Line Plot Math Journal Notes
Students can cut and paste into their journal for note taking on line plots.

Rise over Run Poster
This poster helps students remember the directions RISE and RUN travel.
Grades:
8th - 12th

Central Tendency
I use this for homework, with one week to complete and usually about 30 minutes in class for questions towards the end of the week. The assignment is designed for students to find mean, median, mode, range, standard deviation, and histograms.
Subjects:
Grades:
6th - 9th
Types:
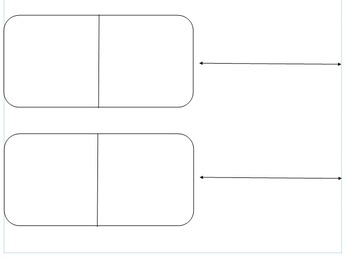
Modeling Equations and Inequalities
My students will model their equation or inequality on the left in the mat and graph it on the number line to the right. It has helped my kids see the modeling and the graph on the same page, side by side.
Subjects:
Grades:
5th - 12th
Types:
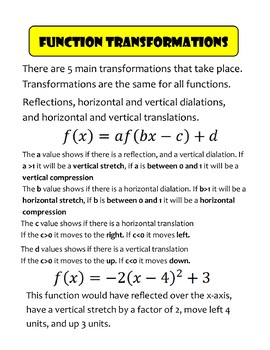
Transformations Poster
Poster given the directions of how to transform functions
Subjects:
Grades:
9th - 12th
Types:
Showing 1-17 of 17 results


