63 results
Free graphing resources for SMART Notebook
Chrysanthemum Name Graph
An interactive name graph for your students to compare the length of their name to their classmates.
Subjects:
Grades:
K - 2nd
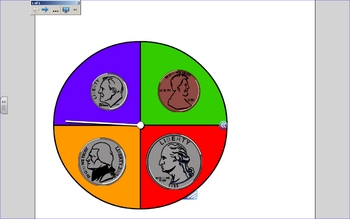
Identifying Coins and Coin Values Coin Spinner
This coin spinner has a penny, a nickel, a dime and a quarter. There are tons of ways to use this spinner, such as:
- coin identification activity where the students identify the coin, then graph or tally the results
- coin idenfication activity where the students identify the coin, then choose a matching coin from a set
- identifying the value of the coin the spinner lands on
- identifying the value of the coin the spinner lands on, recording results, then finding the value of each group
-
Subjects:
Grades:
K - 2nd
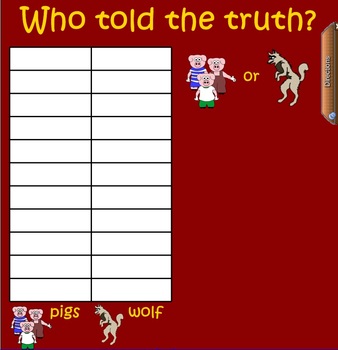
Three Little Pigs VS Big Bad Wolf Graph
After reading the Three Little Pigs and The True Story of the Three Little Pigs have your students use this smartboard file to graph which side of the story they believe is the truth using the interactive graph.
Subjects:
Grades:
PreK - 2nd
Types:
Bug Collection-Organize, Represent and Interpret Data
This file has students organizing data into 3 groups and then interpreting the results and answering questions from the graph. It is meets the standard for 1st grade in CCSS-4a. Organize, represent, and interpret data with up to three categories.
Subjects:
Grades:
K - 2nd
M&M's Frequency Chart
This is an M&M's frequency chart created by Clint Hill to be used in gathering data from M & M activities. This file is a notebook file for use on a SMARTboard. The file can be used alongside actual M & M's or independently of candy. Once M & M data is gathered, it is your choice as to what can be done with it. You could create various graphs representing the data or discuss mean, median, mode, and range (central tendency).
Subjects:
Grades:
K - 4th
Types:
Coordinate Grid, Ordered Number Pair, Graphing Activity
A scenario, student space pioneers have been sucked into a black hole, creates a purpose for students to plot points on a coordinate grid using numbered order pairs. Students are split into spacecrafts and must use the coordinate grid maps to decide where to send their ships. Teams can earn or lose points according to their accuracy. Includes geometric vocabulary, coordinate grids, ordered number pair identification and plotting, finding mid-point of line segments, and reflecting lines across ax
Grades:
5th - 6th
COORDINATE GRAPH INTERACTIVE ACTIVITY
THIS IS A GAME THAT THE STUDENTS CAN GET INVOLVED IN. THE QUADRANT 1 GAME IS A HOT SPOT SMARTBOARD /WHITEBOARD ACTIVITY. PUSH THE START BUTTON AND THE STUDENTS HAVE TO QUICKLY FIND THE COORDINATE POINT BEFORE TIME RUNS OUT. YOU CAN VERY EASILY DETERMINE UNDERSTANDING OF QUADRANT 1 BY WATCHING YOUR STUDENTS PLAY. THE ANSWERS ARE PROVIDED AND I ALSO GAVE YOU TIPS ON HOW TO MAKE ADDITIONAL SLIDES. THERE ARE 2 GAMES INCLUDED FOR YOU TO TRY. THIS CAN BE USED AS AN INTRODUCTION OR A CLASS ACTIVITY
Grades:
6th - 8th

Pet Graph for Smart Board to go with What Pet Should I Get by Dr. Seuss
This is a Pictograph for the smart board. Children may choose a pet from the bottom of the page and add it to the page. I made shades for the row titles so you can make them disappear when it comes time to count the total in case your kids tend to count them in the totals like mine do. I did this graph after I read What Pet Should I Get by Dr. Seuss.
Subjects:
Grades:
PreK - 1st
Kindergarten: Introduction to Graphing with the Letters in Our Names
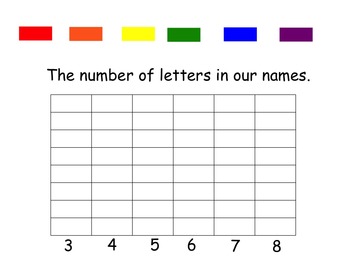
This is a smart board activity graph to show the number of letters in the students names in your class. Students or the teacher can move colored blocks into the appropriate column. This smart board was developed for introducing Kindergarten students to bar graphs.
Subjects:
Grades:
PreK - 1st
Free Interactive Smartboard Pictographs
This is a Smart Notebook file. You Must have Smart Notebook Software to download this file. There are two fun interactive pictographs children will love. Download now.
Grades:
K - 3rd
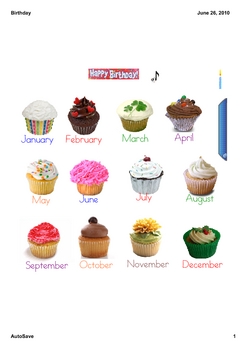
Interactive Birthdays
Help your students celebrate their birthdays with this fun interactive poster. Students place a candle on their month's cupcake. You can type their names and date of their birthday on the cupcake wrapper. Students then can organize the information on a touch graph that is included. My suggestion is to save each page as a Gallery Item and then insert them into your favorite morning calendar. Great to use with my 2010 Smart board calendars.
Subjects:
Grades:
PreK - 2nd
Types:
Christmas Light Graphing Interactive SMARTBOARD Lesson
This Smartboard activity aligns perfectly with my FREE Christmas Light Graphing Worksheet. Using the two resources together will create a fun, interactive and in-depth graphing lesson.
Lesson Objective
Students will be able to correctly sort, count and graph light bulbs based on their color. Students will be able to use the numbers collected to interpret the data.
Common Core Standard Alignment
Grade 1: Measurement and Data
4. Organize, represent, and interpret data with up to three categori
Subjects:
Grades:
PreK - 1st
August Freebie- Through the Year Calendar Weather Attendance SmartBoard
This Interactive SmartBoard unit contains a programmable attendance-hot/cold lunch check in system, calendar, and weather graph for the month of August. It is a sample of my larger Through the Year Calendar Weather Attendance for Interactive SmartBoard. It contains the bright graphics from my cute graphics and will keep your students actively involved in the daily morning activities in kindergarten through 2nd grade. The SmartBoard lesson was constructed using Notebook 11.
This smartboard less
Subjects:
Grades:
K - 2nd
Types:
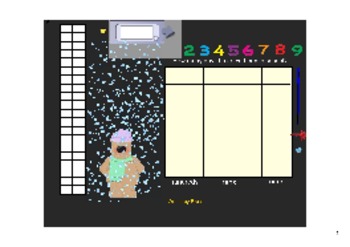
Smart Board Calendar Page: Even/Odd Numbers and Days of School
This page is one of the pages used in a daily calendar time. This page features animated clip art with a winter theme. It supports students as they learn about what makes a number even or odd by graphing a randomly generated number (up to 20). It also helps children visualize place value as they count up to the 100th day of school and beyond by offering a digital version of the straw pocket charts used for place value counting.
Subjects:
Grades:
PreK - 5th
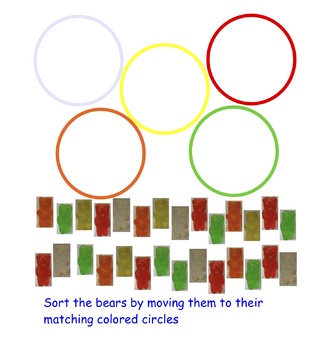
SmartBoard Notebook Lesson Gummy Bear Sort
A five page Notebook file with four different activities to accompany a sorting by color lesson using gummy bears. Activities include a sort where students can drag gummy bears into colored circles, a write-in page to tally the number of bears in each color group, a picture graph to compare the bears in each color and a write-in page for most, least and in all. May be used alone or with a hands on sorting of actual candy. You must have Smart's Notebook software to use this file.
Subjects:
Grades:
PreK - 2nd

Thanksgiving Picture Graph: My Favorite Food
This easy to display picture graph only takes minutes to complete. Use the pictures provided and the infinite cloner option to take a look at your students' favorite Thanksgiving food.
original by Kristi Weeks .
Subjects:
Grades:
K - 2nd
Types:
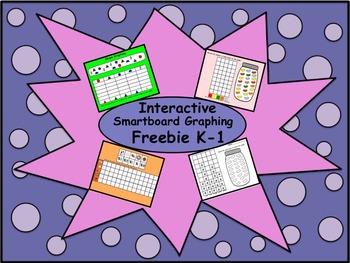
Interactive Smartboard Graphing Freebie K-1
This is a Smart Notebook file. You must have Smart Notebook Software to download this product.
There are 3 interactive graphing pages and one printable page for students.
Grades:
K - 1st

Graphing Data
This interactive Smart Board presentation provides an introduction to bar graphs, line graphs, pie graphs, histograms, line plots and frequency tables. It provides an explanation each type of graph followed by a practice slide. There are a total of 17 colorful pages.
Grades:
4th - 6th
Types:
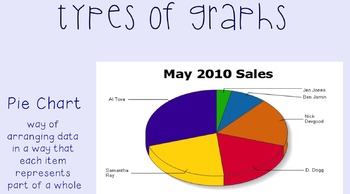
SOL 5.15 Types of Graphs SmartBoard
This SmartBoard introduces graphing! It covers the main types of graphs: Picture Graph, Line Graph, Pie Chart, Table, and Stem & Leaf Plots. It shows a picture a long with a brief description. There is also a short activity to go along with the SmartBoard as you learn!
Credit: Hello Fonts
Grades:
3rd - 6th
Types:
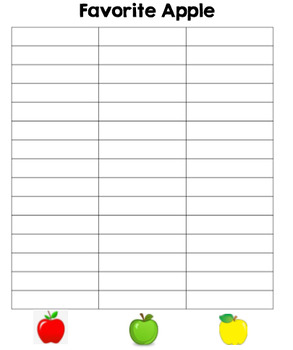
Apple Tasting Class Graphing
Quick and easy way to graph students' favorite apple. Touch and move the apples to graph.
Subjects:
Grades:
Not Grade Specific

Sport Survey
Students drag and drop an icon of a boy or a girl to tally their favorite sport. They can then create a double bar graph with the information. A page is also given so the class can create one together.
Subjects:
Grades:
3rd - 5th
Types:
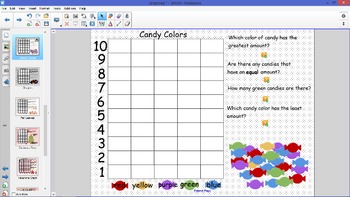
Graphs
I love these SMART Board graphs! The Season Graph is a class opinion graph and would need to be teacher directed (students come up to choose their favorite season). The graph labels may then be dragged over to answer the graphing questions.
The candy graph may be done independently by students. They simply graph the pile of candy and answer the questions. The questions are read aloud when clicked and students may check their answers by clicking on the graphics below.
My Kindergarten Graphing p
Grades:
PreK - 1st
Types:
CCSS:
First Day SMARTBoard Activity and Ice Breaker! ~ FREEBIE
Get your students using your SMARTBoard with this first day ice breaker activity!
Students can discuss a place they visited this summer and manipulate the board at the same time. Graphing page can be copied for students to work at their seats.
Lesson includes intro. page for second and third grade as well.
As this lesson is free, positive feedback is encouraged. Check out my other interactive games and lessons! Thank you!
Subjects:
Grades:
1st - 3rd
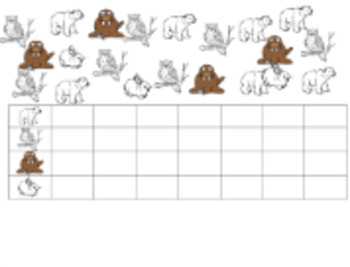
Arctic Animals
With this smart board activity you will be exercising the students shape recognition, graphing skills, winter animal recognition, and complete the use of fine motor skills.
-Graph winter animals
-State the name of the shape
-Guess what animal is hiding
-Use the eraser tool to see what the animal is
Subjects:
Grades:
PreK - K
Types:
Showing 1-24 of 63 results


