126 results
Free graphing interactive whiteboards
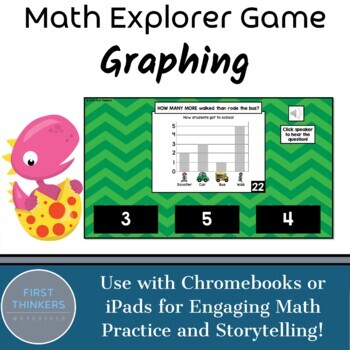
1st Grade Graphing Google Slides PowerPoint Digital Math Game Free
This graphing math activity is a great way to introduce engaging interactive practice to both your math centers and distance learning at home through Google Classroom or Seesaw. Explorer Math enhances both student motivation and engagement by giving students a choice on where to start first and differentiating content. Ultimately, this game will help your students gain mastery in a myriad of concepts!✨Get the full year bundle here and save lots of money!✨Equal or Not Equal10 More 10 Less1 More 1
Grades:
K - 2nd
Types:
CCSS:
Also included in: BUNDLE Full Year Math Games Google Slides PowerPoint Digital Interactive
FREE Analyzing Data & Interpreting Graphs Digital Task Cards for BOOM Learning
A great option for distance learning, these nine digital task cards are about data analysis and graph interpretation of line graphs, bar graphs, and pie charts. There are three graphs, each with three different questions. The three questions per graph gradually increase in difficulty. The question types include typing the correct response, answering True or False, and clicking the correct responses.These digital task cards work on laptops, desktops, Smart Boards, Chromebooks, tablets, and any ot
Subjects:
Grades:
5th - 8th
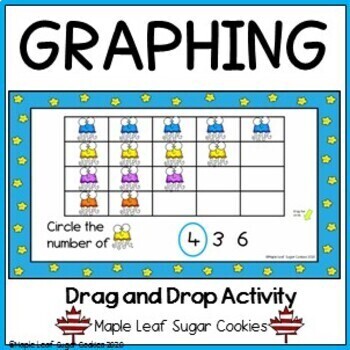
Graphing - Read a Graph - Data Management Slides
***FUN FREEBIE***Graphing Google Slides Math Center. Teach about graphs with this beginning graphing activity. Build skills like read a graph, identify the number of items and number / numeracy skills (counting) with these graphs. Students drag the circles to the corresponding numbers in order to demonstrate knowledge of how to count items in a graph. Interactive way to teach math skills. Great for interactive whiteboards, whole class lessons, math centres, assessment and Google Classroom.
Chrysanthemum Name Graph
An interactive name graph for your students to compare the length of their name to their classmates.
Subjects:
Grades:
K - 2nd
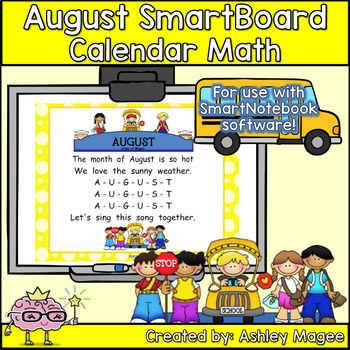
August Calendar Math FREEBIE - For use with SmartBoard ONLY
Which Calendar Math is best for me? Click the link to find out before purchasing.***2018 NOTE: PLEASE download the FREE August Calendar math file FIRST to see if it will work with your version of SmartNotebook software. **PLEASE READ ENTIRE DESCRIPTION BEFORE PURCHASING! THANK YOU!**The yearly dates are editable. Directions are included. There is no need to re-download or purchase this again yearly. If you want a full preview, download this FREE month. (Please note that preview images may reflec
Subjects:
Grades:
K - 2nd
Also included in: SmartBoard Calendar Math and Morning Meeting Bundle
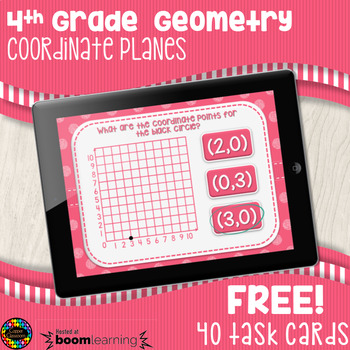
FREE Coordinate Planes Digital Task Cards Distance Learning Boom Cards
These digital task cards work great on laptops, desktops, tablets, or any other mobile device that has access to the internet. They are self grading and you can monitor student progress over the internet. These no-prep task cards require no paper, no cutting, no laminating, and you don't have to worry about where to store them!40 free digital task cards focused on locating points on a coordinate plane. All points are positive numbers.More about BOOM Learning℠…To use Boom Cards, you must be conn
Grades:
3rd - 4th
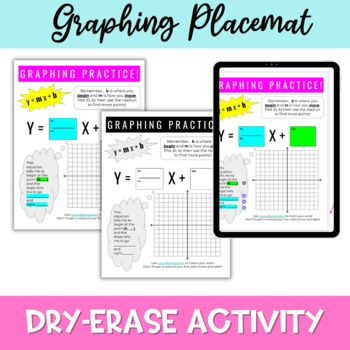
Graphing Linear Functions Practice Activity Digital and Printable
This product contains a printable placemat for students to use as they practice their graphing skills from slope-intercept form.Included:Printable placemat: Color and Black/White versions to meet your needs.Digital placemat for computer use.Written suggestions for easily and effectively using and prepping your placemats for classroom use.
Subjects:
Grades:
7th - 9th
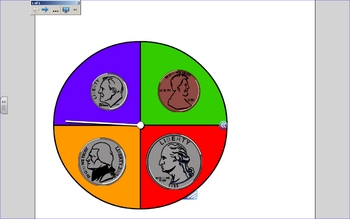
Identifying Coins and Coin Values Coin Spinner
This coin spinner has a penny, a nickel, a dime and a quarter. There are tons of ways to use this spinner, such as:
- coin identification activity where the students identify the coin, then graph or tally the results
- coin idenfication activity where the students identify the coin, then choose a matching coin from a set
- identifying the value of the coin the spinner lands on
- identifying the value of the coin the spinner lands on, recording results, then finding the value of each group
-
Subjects:
Grades:
K - 2nd
Data Analysis and Comparison Review PPT (Graphs)
This is a 24-slide PowerPoint on data analysis and comparison that I use in my 3rd grade classroom as a review before our test. This PowerPoint would also be useful for upper grades to review and activate background knowledge before delving further into data analysis.
It includes 10 vocabulary questions (data, survey, results, frequency table, tally table, pictograph, bar graph, line plot, scale, key). It also includes three slides that contain a bar graph, pictograph and line plot, and contain
Subjects:
Grades:
3rd - 5th
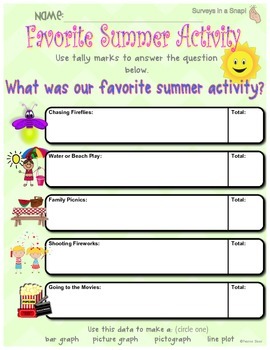
Surveys in a Snap! {FREE Favorite Summer Activity Survey for Graphing}
FREE! Favorite Summer Activity Survey and Graphing Cards! Your students will enjoy getting to know each other as they vote on their favorite summer activities to create a graph of your choice. The survey is great for displaying whole group on your Smartboard or printing. I’ve included choice tickets for picture graphs and pictographs. You have color and black/white options.
This survey is similar to those in my Surveys in a Snap! {The Complete Graphing Packet} . Seventeen survey sets, gra
Subjects:
Grades:
PreK - 3rd
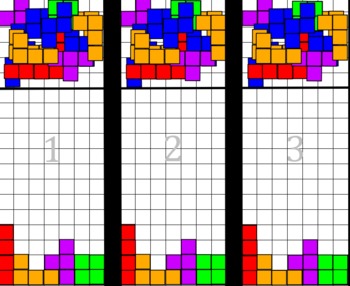
Tetris Transformations with Rotation and Translation Promethean
This is a Tetris transformation game that uses the normal Tetris game and moves to help student understanding of rotation and translation. A great game for students to understand transformations and have lots of fun. It can be used on a Promethean board.
Subjects:
Grades:
10th - 12th
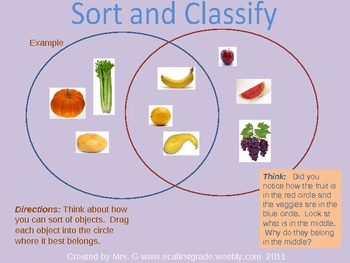
Sort and Classify Interactive Powerpoint
Sort and Classify using a Venn Diagram. This is an interactive Powerpoint activity. Children can individually manipulate this powerpoint to practice sorting and classifying objects.
Subjects:
Grades:
PreK - 2nd
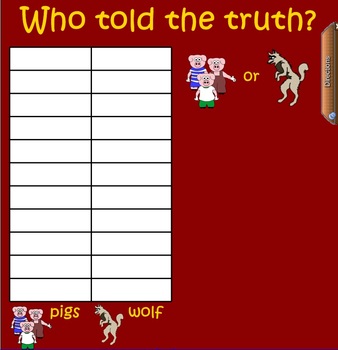
Three Little Pigs VS Big Bad Wolf Graph
After reading the Three Little Pigs and The True Story of the Three Little Pigs have your students use this smartboard file to graph which side of the story they believe is the truth using the interactive graph.
Subjects:
Grades:
PreK - 2nd
Types:
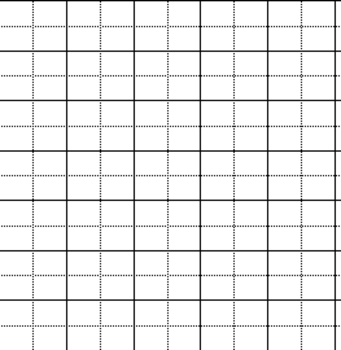
Graph Paper 16
This is a free sample of graph paper in Word format. Simply print out the page, or use it onscreen with an interactive whiteboard. This particular graph is 14x14, with subgrids equaling 28x28. It is one of 30 graph papers included in Graphs Grids & Games, a digital document by John Rice available on TeachersPayTeachers.com
Grades:
PreK - 12th, Higher Education, Adult Education
Bug Collection-Organize, Represent and Interpret Data
This file has students organizing data into 3 groups and then interpreting the results and answering questions from the graph. It is meets the standard for 1st grade in CCSS-4a. Organize, represent, and interpret data with up to three categories.
Subjects:
Grades:
K - 2nd
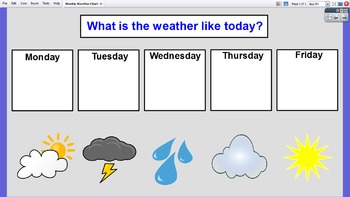
ActivInspire Weekly Weather Chart
This is an ActivInspire weekly weather chart for use on the Promethean Board from Praising PreK. This chart allows students to choose the weather icon of their choice and place it on the corresponding day of the week. It can be saved daily and then reset at the beginning of a new week. It is a great visual for young learners and incorporates well into any interactive circle time or morning meeting.
I also have a 12 month interactive calendar for ActivInspire that I love using in my blended pre
Grades:
PreK - 1st

St.Patrick's Day Math Activity
Teachers fill up ziplock bags of Lucky Charm cereal and distribute bags to small groups of students. Students count the total number of oats and different types of marshmallows. After adding up all of the totals, they find the rang, mean, median, and mode of their data set. They then collect the other groups data and analyze the whole class totals.
Subjects:
Grades:
5th - 7th
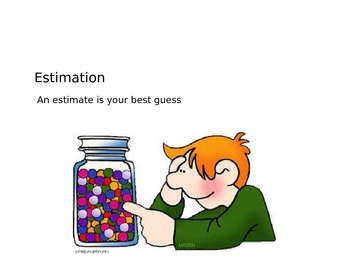
Estimation Powerpoint
Hi everyone!
I came up with this interactive powerpoint presentation to teach the concept of estimation. This powerpoint includes a short definition, examples of what we might estimate, a cute youtube video that is linked in the presentation, and a guided discovery lesson where the children estimate how many teddy bear counters are inside of two glass containers.
I put 10 bears in the first jar and 25 in the second so the children could visibly see that the second jar had more without even cou
Subjects:
Grades:
PreK - 1st
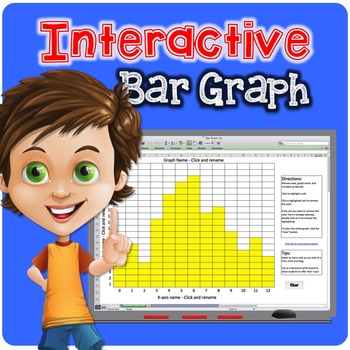
Interactive Bar Graph or Histogram
Brand New! FREE! Graphing has never been so fun! Perfect for Smart Board or Promethean Board graphing! Simply click on a cell to highlight it. Click again to un-highlight it, or press clear to remove all of the input! Use over and over again!
Completely customizable. Change the x- and y-axes names as well as the bar graph name and even the numbers lining the axes. Create bar graphs or histograms depending on how you customize it!
Please note, this is a Microsoft Excel file. In order to use thi
Grades:
Not Grade Specific
M&M's Frequency Chart
This is an M&M's frequency chart created by Clint Hill to be used in gathering data from M & M activities. This file is a notebook file for use on a SMARTboard. The file can be used alongside actual M & M's or independently of candy. Once M & M data is gathered, it is your choice as to what can be done with it. You could create various graphs representing the data or discuss mean, median, mode, and range (central tendency).
Subjects:
Grades:
K - 4th
Types:
Coordinate Grid, Ordered Number Pair, Graphing Activity
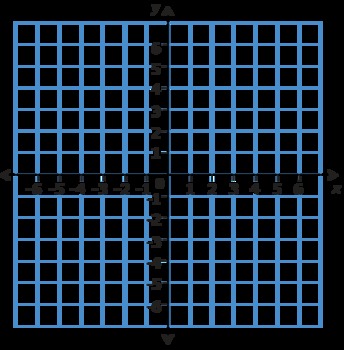
A scenario, student space pioneers have been sucked into a black hole, creates a purpose for students to plot points on a coordinate grid using numbered order pairs. Students are split into spacecrafts and must use the coordinate grid maps to decide where to send their ships. Teams can earn or lose points according to their accuracy. Includes geometric vocabulary, coordinate grids, ordered number pair identification and plotting, finding mid-point of line segments, and reflecting lines across ax
Grades:
5th - 6th
K-1 Daily Math Flipcharts
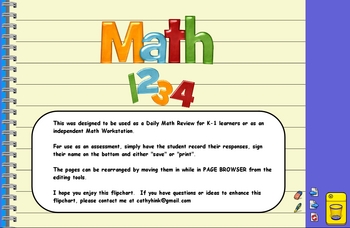
This was designed to be used as a Daily Math Review for K-1 learners or as an independent Math Workstation.
There are 36 questions (2 per flipchart) that cover number sense, geometry and data analysis.
For use as an assessment, simple have the student record their responses, sign their name on the bottom and either save or print.
The pages can be rearranged by moving them in while in PAGE BROWSER from the editing tools.
I hope you enjoy this flipchart. If you have questions or ideas to enha
Grades:
PreK - 1st
COORDINATE GRAPH INTERACTIVE ACTIVITY
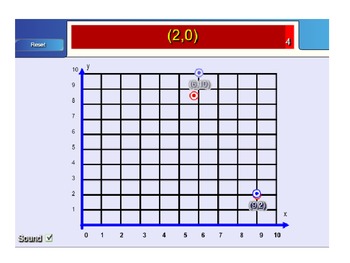
THIS IS A GAME THAT THE STUDENTS CAN GET INVOLVED IN. THE QUADRANT 1 GAME IS A HOT SPOT SMARTBOARD /WHITEBOARD ACTIVITY. PUSH THE START BUTTON AND THE STUDENTS HAVE TO QUICKLY FIND THE COORDINATE POINT BEFORE TIME RUNS OUT. YOU CAN VERY EASILY DETERMINE UNDERSTANDING OF QUADRANT 1 BY WATCHING YOUR STUDENTS PLAY. THE ANSWERS ARE PROVIDED AND I ALSO GAVE YOU TIPS ON HOW TO MAKE ADDITIONAL SLIDES. THERE ARE 2 GAMES INCLUDED FOR YOU TO TRY. THIS CAN BE USED AS AN INTRODUCTION OR A CLASS ACTIVITY
Grades:
6th - 8th
Midpoint of a Line, Translation and Reflection of 2D Shapes. PPT File
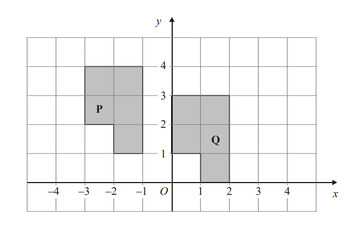
This is a power point presentation that covers the topic midpoint of a line segment, the coordinate of a point that lies a fraction of a line segment. Translation of 2D shapes with examples that cover performing the translation and describing the translation.Reflection of 2D shapes with examples that cover performing the reflection and describing the reflection.
Showing 1-24 of 126 results


