21 results
Free statistics interactive whiteboards
Data Analysis and Comparison Review PPT (Graphs)
This is a 24-slide PowerPoint on data analysis and comparison that I use in my 3rd grade classroom as a review before our test. This PowerPoint would also be useful for upper grades to review and activate background knowledge before delving further into data analysis.
It includes 10 vocabulary questions (data, survey, results, frequency table, tally table, pictograph, bar graph, line plot, scale, key). It also includes three slides that contain a bar graph, pictograph and line plot, and contain
Subjects:
Grades:
3rd - 5th
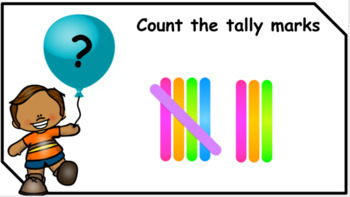
*FREE Sample* No Prep Tally Marks *Google Slides/Distance learning*
This is a free sample of my No Prep Digital Resource of Counting Tally Marks.This is designed for Google Slides *Widescreen 16:9.I want to help all those teachers struggling to find new ideas for their Google Slides. The student types the answer into the text box.I have the full version with 40 slides for sale in my store.
Subjects:
Grades:
K - 3rd
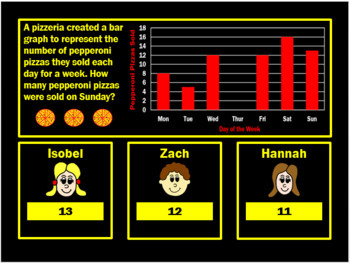
Bar Graphs Powerpoint Game by Arithmetickx
A fun, interactive PPT game to develop children’s knowledge and understanding of bar graphs. This game is suitable for Grade 2 and beyond. All Arithmetickx games incorporate 10 questions which increase in difficulty as the games progress. The games include problem solving and reasoning questions. They are ideal for a 'hook' activity, teaching tool, or assessment tool. All games include a Student Response Sheet.
Subjects:
Grades:
2nd - 5th
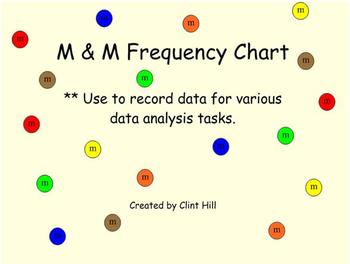
M&M's Frequency Chart
This is an M&M's frequency chart created by Clint Hill to be used in gathering data from M & M activities. This file is a notebook file for use on a SMARTboard. The file can be used alongside actual M & M's or independently of candy. Once M & M data is gathered, it is your choice as to what can be done with it. You could create various graphs representing the data or discuss mean, median, mode, and range (central tendency).
Subjects:
Grades:
K - 4th
Types:
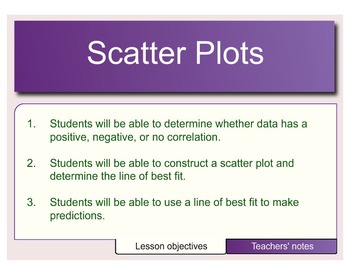
Scatter Plots
This lesson explores creating and analyzing scatter plots by determining the correlation: positive, negative, or no correlation. It also incorporates making predictions based on the line of best fit.
Negative Correlation, Data Display, Scatter Plot, Positive Correlation, Line of Best Fit, Best Fit Line, Correlation, No Correlation, Independent Variable, Dependent Variable
Subjects:
Grades:
7th - 9th
Types:
CCSS:
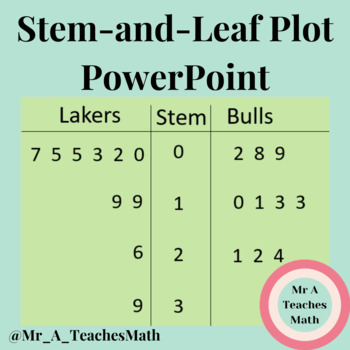
Stem-and-Leaf Plots
PowerPoint to support explanation and discussion of stem-and-leaf plots
Subjects:
Grades:
6th - 9th
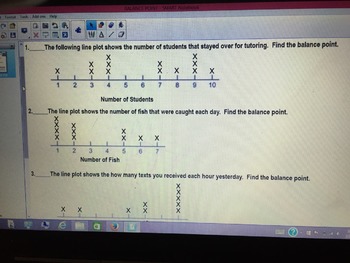
MEAN AS BALANCE POINT & MEAN, MEDIAN, & MODE REVIEW
Brief exercise related to the 6th grade concept (Virginia)of mean as balance point, with some problems related to mean, median, and mode.
Subjects:
Grades:
6th
Types:
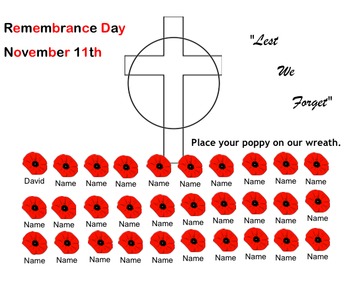
Remembrance Day Morning Activities for All Grades
This notebook is designed to aid teachers in the morning of Remembrance Day.
There are is a copy of Flanders Field. - Potential for Fluency Activity
Infographic on Remembrance Day - Potential for Numeracy/Literacy Discussion
Commercial from Bell - Potential Media Literacy Discussion
The Poppy Story for K-4 - General Knowledge
The Poppy Story for 5-8 - General Knowledge
With exception of the attendance, all are resources that I have used are not mine. The authors of these resources are to be c
Subjects:
Grades:
K - 8th
Types:
Daily Math Warm Ups Wks 1 & 2 Probability
Week 1 and 2 of a series of 20 weeks of daily math warm ups brought to you by Dino Might Duo! They can be used as warm ups, reviews, mini lessons, or however you see fit! Each day has 6 carefully thought out and unique math questions that gets student brains thinking. The beginning of week 2 has a mini lesson on Probability that goes along with the Common Core standards.
Subjects:
Grades:
4th - 7th
Types:
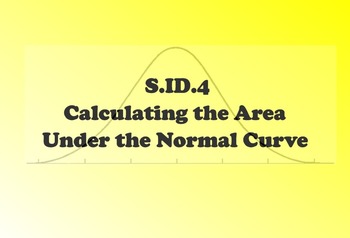
SID.4 Calculating the Area Under the Normal Curve.
This lesson teaches students how to use the mean and standard deviation of a data set to create a normal curve and how to calulate the area (population percentage) under the normal curve given a range of values.
This lesson includes a SMART Notebook Presentation, guided notes with class work problems, and an answer key. The guided notes correspond with the SMART Notebook Presentation.
Subjects:
Grades:
9th - 12th
CCSS:
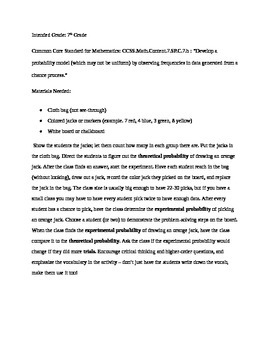
Probability Activity, 7th Grade
This is a basic outline for a 7th-grade probability activity, meant to be used after a lesson on experimental and theoretical probability has been taught. The outline includes the Common Core Standard for Mathematics implemented for easy referencing, and detailed instructions for the activity are included. You will need a bag, colored markers or jacks, and a white board or chalkboard. This activity can be modified easily.
Subjects:
Grades:
7th
CCSS:

Random Student Chooser
Randomly choose a student for activities, reading or other tasks. Able to be put on a projector or smart board as younger students are mesmerised in the roulette-like animation.FEATURES:⠀⠀❖ Remembers class lists⠀⠀❖ Multiple class support⠀⠀❖ Roulette animation⠀⠀❖ Can be projected or used with a smart boardREQUIREMENTS⠀⠀❖ Works only with Windows computers⠀⠀❖ No Flash or Java needed
Grades:
Not Grade Specific
EDITABLE MATHS SLIDE WITH GRAPH PAPER
Editable slides to teach math concepts. Grid paper included for bookwork expectations and teacher modelling.
Subjects:
Grades:
Not Grade Specific

LOOK NO FURTHER, YOUR HIGHLY EFFECTIVE COMMON CORE LESSON IS HERE!
LOOK NO FURTHER, YOUR COMMON CORE HIGHLY EFFECTIVE ALIGNED LESSON IS HERE. NOT JUST AN ACTIVITY! REAL LIFE CAPTIVATING SCENARIOS.
-DOK QUESTIONING
-DIFFERENTIATION
-RUBRIC BASED ACTIVITY
-LITERACY VENTURE
-ASSESSMENT
In this bundle you will receive:
- Smart Notebook Slides
- Pamphlet
- Rubric Based Activity Task Card
- Teacher Manual
This lesson provides a range of questioning techniques meeting the criteria of the Common Core Standards. Aligned with these standards you will be provided with
Subjects:
Grades:
6th - 9th
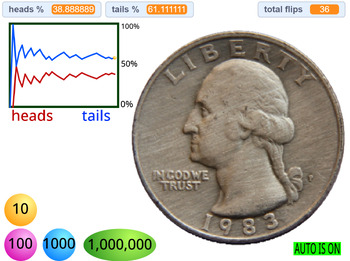
Coin Flip Simulator - Browser-based Smart Board tool
This is a program for simulating coin flips. Features:Single click single flipRapid flips in increments of 10, 100, 1000, and 1,000,000Flip recording and graphingAutomatic continuous flipping and graphingAnimated coin flips on single flips and auto flipsMade in Turbowarp, should work in any Scratch 3 variant. HTML file should work in any standards-compliant browser (I have had problems using these in Edge.) Just drag and drop the HTML file into a browser.
Subjects:
Grades:
Not Grade Specific
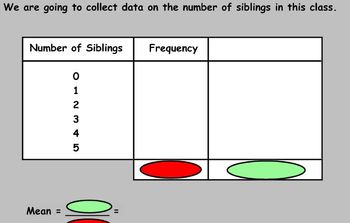
SmartNotebook Lesson - Calculating averages from a table
This notebook file can be used as an entire lesson to teach calculating averages from a table.
The first slide contains a starter asking students to find the mean, median and mode from sets of data. The second slide can be used to collect your own data in the class in order to show how to calculate the mean.
Following that there is another example, before finally showing two questions on the same slide which the students can work through.
Subjects:
Grades:
6th - 11th, Higher Education

Standardizing a Normal Distribution
This Smart Notebook introduces the concept of z-scores and standardizing.
Subjects:
Grades:
12th
Types:

Box and Whisker Plot Lesson
Covers the topic of Box and whiskers standard within Common Core and Georgia Standards
Subjects:
Grades:
6th - 7th
Types:

Probability density function
This is a short teacher's guide to the resources illustrating probability density functions, available at mavisresources.com
These are free, online, animated resources for teaching advanced maths on the interactive whiteboard.
Subjects:
Grades:
10th - 12th
Showing 1-21 of 21 results


