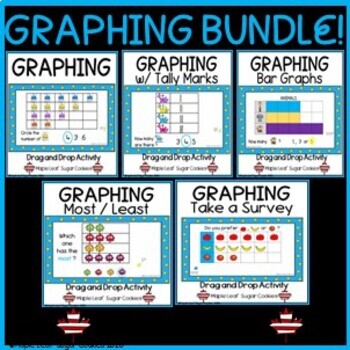
GRAPHING UNIT!!! ***Includes 5 Sets*** (Different Concepts) ** DATA ** Slides
Maple Leaf Sugar Cookies
407 Followers
Grade Levels
PreK - 3rd, Homeschool
Subjects
Resource Type
Standards
CCSSK.MD.A.2
CCSSK.MD.B.3
CCSS1.MD.C.4
CCSS2.MD.D.10
Formats Included
- Google Slides™
Maple Leaf Sugar Cookies
407 Followers

Includes Google Apps™
This bundle contains one or more resources with Google apps (e.g. docs, slides, etc.).
What educators are saying
These slides were perfect for teaching graphing to my kindergarten class. I appreciate the many different ways shown here to demonstrate this concept.
My students are able to use this digital resource independently. It is easy, engaging and fun for them.
Products in this Bundle (5)
Description
***FIVE DIFFERENT GRAPHING ACTIVITIES***Save on this complete interactive graphing bundle!!! Teach about beginning graphing, reading picture graphs, identifying quantities, reading tally marks, using bar graphs, determining the most and least of a group and taking a survey using cute moveable clipart!!! Fun and engaging way to teach your entire graphing unit!!! Use all at once or save for different times throughout the school year. Excellent for differentiating instruction based on students' needs. Perfect for interactive whiteboards, math centres, assessments and/or Google Classroom! Great value!!!
Total Pages
Answer Key
N/A
Teaching Duration
N/A
Report this resource to TPT
Reported resources will be reviewed by our team. Report this resource to let us know if this resource violates TPT’s content guidelines.
Standards
to see state-specific standards (only available in the US).
CCSSK.MD.A.2
Directly compare two objects with a measurable attribute in common, to see which object has “more of”/“less of” the attribute, and describe the difference. For example, directly compare the heights of two children and describe one child as taller/shorter.
CCSSK.MD.B.3
Classify objects into given categories; count the numbers of objects in each category and sort the categories by count.
CCSS1.MD.C.4
Organize, represent, and interpret data with up to three categories; ask and answer questions about the total number of data points, how many in each category, and how many more or less are in one category than in another.
CCSS2.MD.D.10
Draw a picture graph and a bar graph (with single-unit scale) to represent a data set with up to four categories. Solve simple put-together, take-apart, and compare problems using information presented in a bar graph.


