422 results
Graphing study guide pdfs
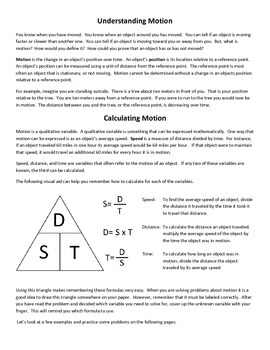
Calculating Speed, Time, Distance, and Graphing Motion - Distance Time Graphs
This activity is centered around the concept of motion. This activity defines motion and gives instruction and examples on how it cat be calculated and graphed. This activity includes informational text on calculating and graphing motion as well as a variety of problems to check for understanding. There are problems that involve solving for speed, distance traveled, and time in motion. Distance vs. Time and Speed vs. Time graphs are discussed. Twelve distance vs. time graphs and twelve spe
Subjects:
Grades:
4th - 9th
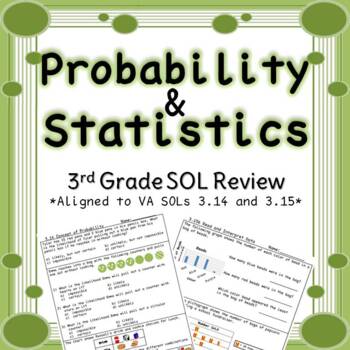
Third Grade Probability and Graphing Review
Now aligns to the new 2016 VA SOLs. This product is a 5 page practice packet/mixed review that aligns to 3rd grade VA Math SOLs. It covers all the SOLs in the 3rd grade Probability/Statistics Strand, including the following math topics:-Collecting Data-Organizing Data-Representing Data-Interpreting Data-Bar Graphs-Picture Graphs-Probability-CombinationsAn answer key is included for each page. This product can be used as whole group practice, small group practice, independent practice, remediatio
Subjects:
Grades:
2nd - 4th
Types:
Also included in: Third Grade Math SOL Review Bundle
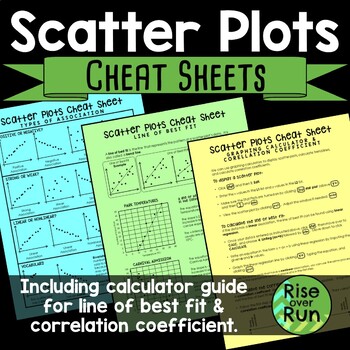
Scatter Plot Cheat Sheets Printable Guided Notes
Detailed sheets for the following topics: •Types of Association & VocabularyThis page shows examples of positive, negative, strong, weak, linear, and nonlinear association. It also shows clusters and outliers.•Line of Best FitThis page explains what a line of best is (or trend line) along with examples and nonexamples. It has 2 real world connections and how to interpret the line of best fit.•Graphing Calculator Guide & Correlation CoefficientThis sheet gives step by step instructions fo
Subjects:
Grades:
8th - 9th
CCSS:
Also included in: 8th Grade Math Activities & Lessons Bundle for the Whole Year
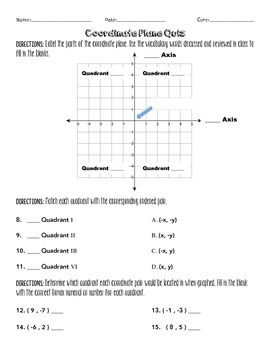
Coordinate Plane Quiz
The Wright Ladies present a coordinate plane quiz. Great review for students to check understanding of the basics of the coordinate lane and graphing points.
Included in this download is a PDF version of the formative assessment and answer key.
Grades:
4th - 10th
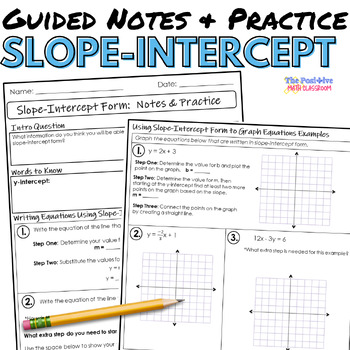
Slope Intercept Form Guided Notes and Practice
Print and go with this set of guided notes and practice. These easy to use notes cover how to write linear equations in slope intercept form as well as how to graph the line based on this form. Best of all, these sheets will help organize your student's notes and give them confidence with such an important algebra concept. This set of notes includes:Intro Question: Helps your students to make a connection to new informationWords to Know: Highlights essential terms in the lessonExamples: Guided
Grades:
7th - 9th
Types:
CCSS:
Also included in: Slope and Graphing Linear Equations Bundle

Linear Functions
Linear Functions
This is a great one page cheat sheet on the following three forms of a line...
Intercept Form, Point Slope Form, and Standard Form
Also included, is how to find intercepts and slopes.
Two sheets are included, one in color and the other in black and white.
Easily made into a tri-foldable.
Connect with Me
Follow my WebsiteMath to the Core on FacebookMath to the Core BlogMath to the Core on PinterestMath to the Core on TwitterMath to the Core on Instagram
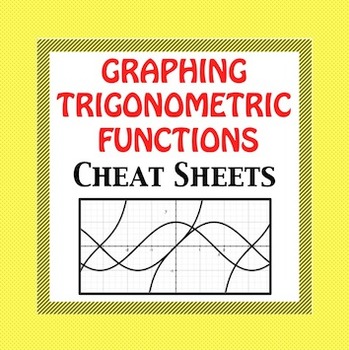
Trig Functions - Graphing Cheat Sheet
Trig Functions - Graphing Cheat Sheet*****UPDATED with different formula versions******Text books make graphing trig functions so complicated. I have simplified the process so that even below average students can follow the process easily and graph trig functions without frustration. I have passed these trig notes out to absent students and NO explanation was necessary! Trig graph paper also is included.The different versions use different formulas and variables.y = asin(bx−c)+d y = asi
Subjects:
Grades:
10th - 12th, Higher Education, Adult Education
Types:
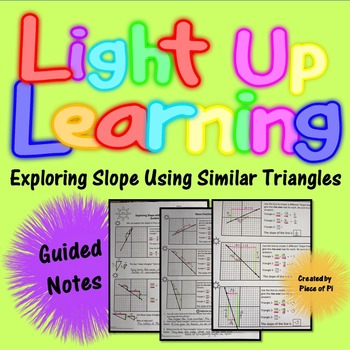
Slope Similar Triangles with VIDEO UPDATE Guided Notes Distance Learning 8.EE.6
Explore Slope using Similar Triangles. Guided Notes. Color Coding with Highlighters! Common Core Standard 8.EE.6. Keeps students engaged as they learn and explore new concepts. This color-coding technique works well with students of all levels! The recent addition of 2 instructional videos can help with distance learning, student review, and sub plans!Bundled for Savings!Slope Similar Triangles Notes and HomeworkLight up their learning! This technique has worked beautifully with my special-educa
Grades:
7th - 9th
Types:
CCSS:
Also included in: 8th Grade Math Review Activities Notes Mega Bundle
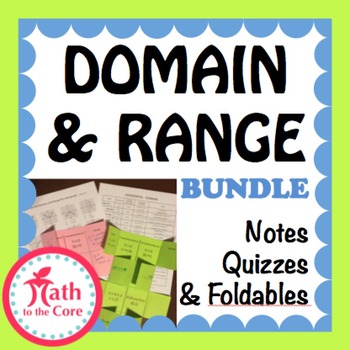
Domain and Range of a Graph Bundle
Domain and Range of a Graph Notes, Homework, and Quiz Bundle
with inequality, interval, and set builder notation
This will stop all confusion of Domain and Range Notation!!!
My students find the chart invaluable especially the Vertical Graph depictions.
Included in this package
1. Complete Chart for Domain and Range Notation
2. Complete Chart for Domain Notation
3. Complete Chart for Range Notation
4. Foldable Template
5. Quiz 1 (easy) version A
6. Quiz 1 Key
7. Quiz 2 (easy) version
Grades:
7th - 12th, Higher Education, Adult Education
Types:
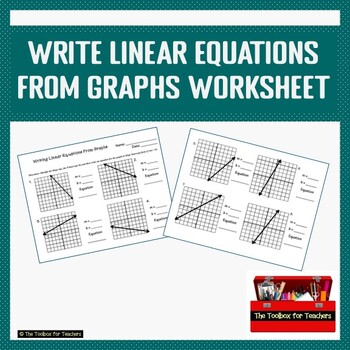
Writing Linear Equations from Graphs Worksheet Slope Intercept Form
Writing Linear Equations from Graphs WorksheetThis is a great Common Core Aligned Assessment that assesses a student’s ability to Write Linear Equations in Slope Intercept Form when given a graph only. The assignment contains (8) Problems.The Answer Key is included.The directions on the assignment reads as follows:Directions: Identify the Slope (m), the Y-Intercept (b) and then write an equation for the graph in Slope Intercept Form (y=mx + b).Let’s connectThe Toolbox for Teachers on PinterestTh
Subjects:
Grades:
9th - 12th
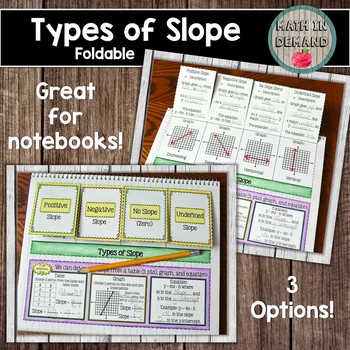
Types of Slope Foldable (Great for Math Interactive Notebooks)
Included is a foldable on the different types of slope. This foldable is a great way for students to distinguish the difference between a positive, negative, zero, and undefined slope (no slope). In addition, students will learn how to determine the slope given a table (or two points), graph, and equation.There are 3 options for this foldable: (1) fill-in template, (2) blank template, and (3) answer key template. This makes it great for differentiation!CLICK HERE to see my math foldables bundl
Grades:
7th - 9th
Also included in: Math Foldables Bundle (Includes All Math Wheel Foldables)

Conic Sections Cheat Sheet - Foldable for Circle, Parabola, Ellipse, Hyperbola
Conic Sections Cheat Sheet - Foldable for Circle, Parabola, Ellipse, and Hyperbola. Graph paper included!
*** UPDATED *** Now with highlighted a,b, and c lengths AND a version with parametric equations.
Create a foldable or just pass out the Conic cheat sheet, the choice is yours.
Please view my free preview.
I also use the unfilled conic foldable as a quiz or pretest warmup.
This is a comprehensive guide to the 4 conic sections (circle, parabola, ellipse, and hyperbola).
This file inc
Subjects:
Grades:
9th - 12th, Higher Education, Adult Education
Types:

Absolute Value Function Graph Transformations - Notes, Charts, and Quiz
Absolute Value Function Graph Transformations - Notes, Charts, and Quiz
I have found that practice makes perfect when teaching transformations.
In this bundle you will find.
1. A chart depicting the 8 basic transformations including function notation and description. (Perfect for notes.)
2. A chart depicting the 8 basic transformations without the equation. (I have my students use this sheet as a graphic organizer.
3. A chart depicting the 8 basic transformations without the graph. (Great fo
Grades:
7th - 12th, Higher Education
Types:
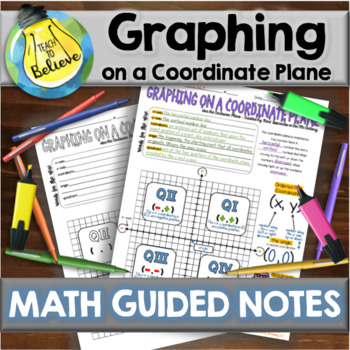
Graphing on a Coordinate Plane - Guided Notes
Graphing on a Coordinate Plane - Guided NotesThis set completely covers the parts of the coordinate plane and how to graph a coordinate. What is Covered:-Coordinate Plane Terminology-Quadrant Specifics-How to Graph a CoordinateWhat's Included:-Blank Student Copy-Typed Colorful Key-Completed Student SampleHow to Use This Product:After students have completed these guided notes, it is best for them to keep them in sheet protectors in a math folder. You can download a FREE blank table of contents f
Grades:
4th - 7th

Quadratic Equation
Quadratic Equation
Quadratic Function Cheat Sheet - Foldable for the Equation of a Parabola
UPDATED - Now with a fill in the blank version. Perfect for note taking or a quiz.
This is a great one page cheat sheet on the following three forms of a parabola...
Intercept Form, Vertex Form, and Standard Forms.
Details regarding maximum, minimum and intercepts included.
Easily made into a tri-foldable.
Products you may also like...
Quadratic/Parabola Function Graph Trasformation - Card Ma
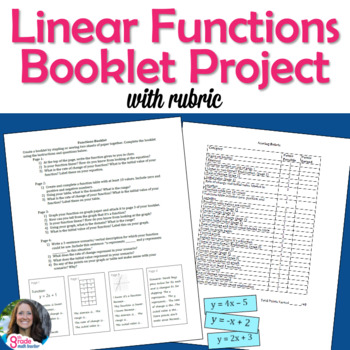
Linear Functions Project with Rubric Student Created Booklet
Here's a way to assess students over linear functions in multiple representations with a small project! This resource contains step-by-step student directions for students to create a Linear Functions booklet and a scoring rubric. There are also examples for students to see what to include. Simply print the pages and see what your students can do!Using the instructions, students create a booklet about linear functions in which they answer questions, write their own verbal description, create a t
Grades:
8th
Types:
Also included in: 8th Grade Math Functions Resources - Notes, Activities, and Posters
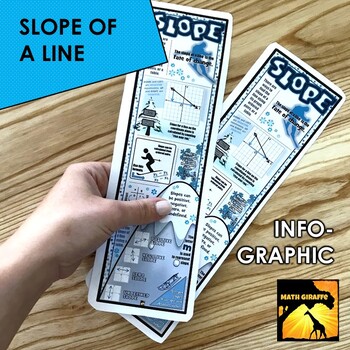
Slope Infographic
Slope of a Line - Main Ideas for Slope:This is a great study guide or graphic organizer for students working with linear equations and learning how to find slope. The infographic contains main ideas about slopes of lines. These infographics are intended to be printed two-per-page. You can cut each one out individually and use as a bookmark or study guide. You can also 3-hole punch as a half sheet for student binders. Take a look at the preview file to see the layout. *** This item is also a
Grades:
6th - 9th
Types:
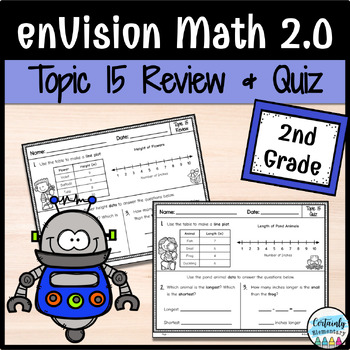
enVision Math 2.0 | 2nd Grade Topic 15: Review and Quiz
This resource contains review AND quiz worksheets that align well with Topic 15: Graphs and Data from enVisionMath®, Version 2.0 (2020). I am ALWAYS looking for ways to encourage student independence, especially during a review or quiz. This resource was designed to be straightforward and engaging for students to work on independently. What skills/lessons are being practiced? Lesson 1: Line PlotsLesson 2: More Line PlotsLesson 3: Bar GraphsLesson 4: Picture GraphsLesson 5: Draw Conclusions from
Subjects:
Grades:
2nd
Also included in: enVision Math 2.0 | 2nd Grade Review and Quiz - BUNDLE

Quadratic/Parabola Function Graph Transformations - Notes, Charts, and Quiz
Quadratic Function Graph Transformations - Notes, Charts, and Quiz
I have found that practice makes perfect when teaching transformations.
In this bundle you will find....
1. A chart depicting the 8 basic transformations including function notation and description. (Perfect for notes.)
2. A chart depicting the 8 basic transformations without the equation. (I have my students use this sheet as a graphic organizer.
3. A chart depicting the 8 basic transformations without the graph. (Great for
Grades:
7th - 12th
Types:
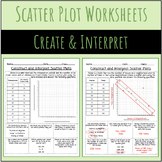
Scatter Plot Graphing: How-To Printable
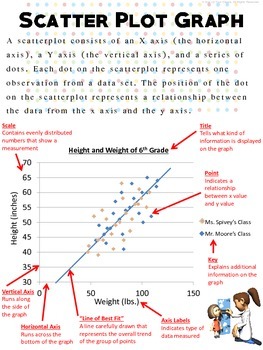
These printables help students read scatter plots, data, and charts that display gathered numbers visually. It includes the following:
-An informative model scatter plot graph
-Data tables to be completed
-Analysis questions to answer after reading graphs
-Whole scatter plots to be created on their own
This would be a huge help in science class to teach how to display gathered data via scatter plots. It could also be used in math class when covering graphs. Enjoy!
BUY THE WHOLE GRAPHING BUND
Grades:
5th - 9th
Slope Man and Gal Creative Slope Activity
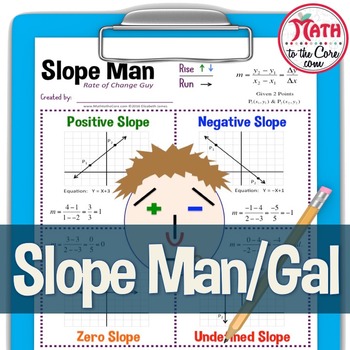
Understanding slope can be confusing. Using this activity, students create a great visual to help remember the 4 different types of slopes.
Students create a unique face to demonstrate the 4 types for slopes.
Positive, negative, zero and undefined slope are included.
Equations of the lines are also included to help differentiate between the slope of a line and the equation of a line.
20 versions of the worksheet are included for personal customization.
Products you may also like..
Grades:
7th - 12th, Higher Education, Adult Education
Types:
Second Grade Common Core Math -Measurement and Data 2.MD.9-10
This 50 page unit is designed for 10 days of instruction. This unit is aligned with Common Core Math Standards 2.MD.9 and 10. Just copy the student book, staple, grab your lesson plans and you are ready to go! Included in this unit are:
Student Book Cover
Pages for a student book
Classwork for each day
Homework for each day
Unit test
Lesson Plans for 10 Days
Teaching these two standards couldn't be made easier for you. If you like this unit, check out the 3 Geometry Units in my TPT Store which
Subjects:
Grades:
2nd
Types:
Linear Equations Quiz Review Slope Graphing Slope Intercept Skills Homework
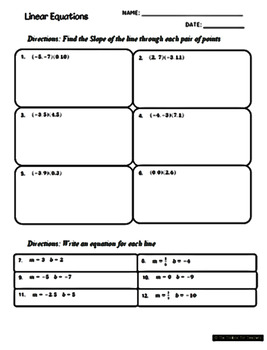
Linear Equations Quiz Review Slope Graphing Slope Intercept Skills HomeworkThis PDF Worksheet contains 18 problems and the Answer Key.(6) problems: Calculating Slope(6) problems: Writing equations when given the “m” and “b”(4) problems: Write each equation in Slope Intercept Form. Then identify the slope & the y-intercept.(2) problems: Graphing Slope Intercept FormI appreciate your feedback and product ratings. Let’s connectThe Toolbox for Teachers on PinterestThe Toolbox for Teachers on Fac
Subjects:
Grades:
8th - 12th, Adult Education
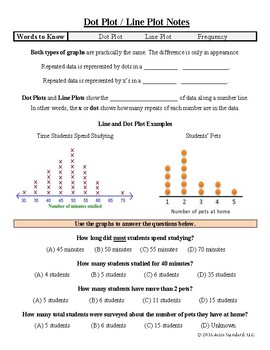
Dot Plots and Data Distribution Notes
A visually appealing and interactive way to teach about dot plots, line plots and the distribution of data. Both reading and creating dot/line plots is addressed on the first page of the notes. The entire second page is dedicated to describing the shape of the data. From bell curves to skewed left or right, dot plots are used to describe statistical elements of data sets.
Actis Standard notes are a great way to teach students how to take notes in an easy to follow fill-in-the-blank format. Comp
Subjects:
Grades:
5th - 7th
Showing 1-24 of 422 results


