80 results
Graphing handouts for Microsoft PowerPoint
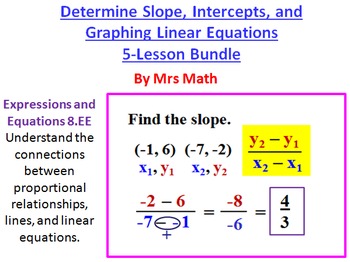
Slope, Intercepts, and Graphing Linear Equations Power Point 5 Lesson Pack
PDF and Microsoft word versions included.Are you looking for an all inclusive package that has everything you need to teach finding the slope, intercepts, and graphing equations? This is it! Lesson Power Points, classworks, homeworks, quizzes, a set of test questions, and even some teaching tips embedded in the lesson for instruction. If you are teaching this topic from scratch these resources will be a lifesaver. They can also be an excellent supplement to the resources you are already usin
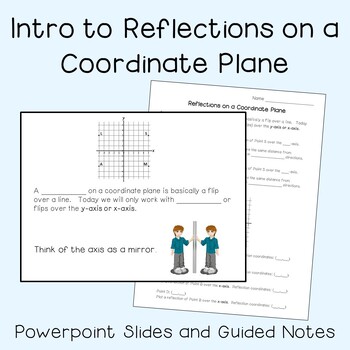
Intro to Reflections on a Coordinate Plane (6th Grade)
This is a basic introduction to reflections on a coordinate plane using only integers (no fractions or decimals). I use this with my scholars who have disabilities, especially learning disabilities.Update 11/4/2023: Now includes a separate guided notes page.See preview for everything that is included.Answers included in the notes section of the powerpoint.MAFS.6.NS.3.6 / CCSS.Math.Content.6.NS.C.6 Understand a rational number as a point on the number line. Extend number line diagrams and coord
Subjects:
Grades:
6th - 7th
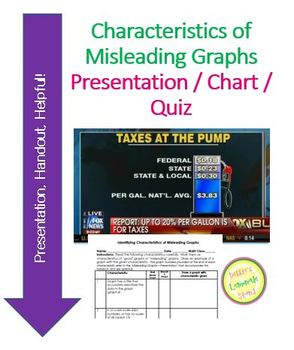
Misleading Graphs - Presentation, Graph Org, and Practice or Quiz
Having trouble finding resources on the topic Misleading Graphs! I did - which is what led me to create this resource. I have found it very useful in my classroom, I hope you do also!
One-stop shopping for all your misleading graph needs! 35-page PowerPoint presentation with examples of all kinds of misleading charts to aid in teaching and class discussion. Additionally included is a file that has a handout of misleading graph characteristics, as well as a quiz that can be used for instruct
Grades:
7th - 9th
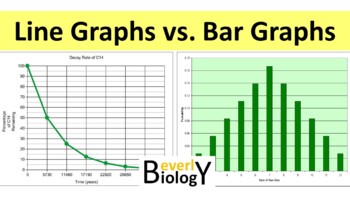
How to Make a Graph PowerPoint: Bar vs Line Graphing
This PowerPoint explains the basic properties of a line graph verses a bar graph. There is also a free handout included for your students to use as you present the lesson.This is NOT the typical bullet point PowerPoint. This is very much an animated, multimedia presentation filled with engaging images and animations to better enhance learning. Better yet! You can preview this entire PowerPoint prior to purchase on my YouTube channel to make sure it suits your needs:Preview on YouTubeThere are 3
Subjects:
Grades:
6th - 12th
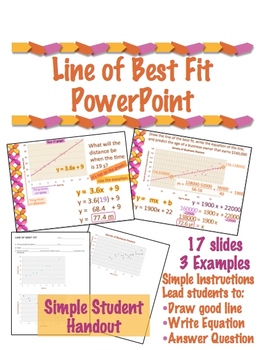
Line of Best Fit PowerPoint with Student Work Along Sheet
This is a zipped file that contains an 18 slide animated powerpoint and pdf & WORD versions of the student handout.
The FREE preview shows all the PowerPoint slides.
The standards shown are 11th grade Pennsylvania standards - easy to delete those 2 slides. (they are in addition to the 18 content slides)
The lesson gives pointers for drawing a good line, then 3 example of drawing lines, finding slopes, and writing the equation of the line.
There are 2 additional questions that use the
Subjects:
Grades:
9th - 11th
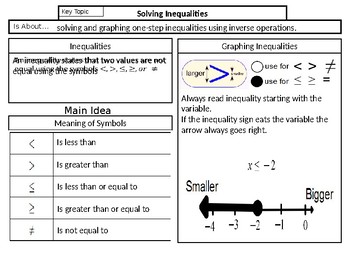
Solving and Graphing One and Two-Step Inequalities Notes SOL 7.13
7.13 The student will solve one- and two-step linear inequalities in one variable, including practical problems, involving addition, subtraction, multiplication, and division, and graph the solution on a number line.
Grades:
6th - 8th
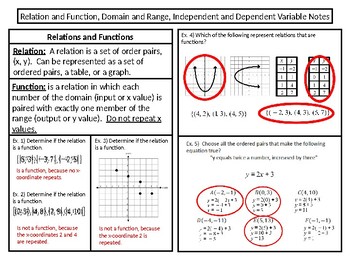
Relation and Function, Domain and Range, Independent and Dependent Variable Note
SOL--> 8.15: The student will a) determine whether a given relation is a function; and b) determine the domain and range of a function.--> 8.16: The student will c) determine the independent and dependent variable, given a practical situation modeled by a linear function.
Grades:
6th - 8th
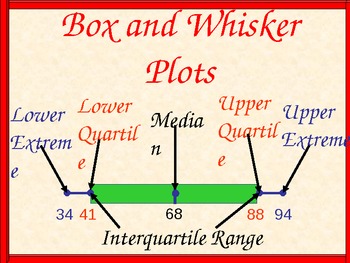
Box and Whisker Plots and Handout, Math PowerPoint
A unique 11 page lesson on Box and Whiskers Plots. The lesson begins with 2 real life situations on the heights of roller coasters.The second roller coaster will have an outlier to illustrate the effect on the box and whisker plot. Two additional slides will have runs scored by your favorite team and one to assign for homework. Worksheets for the student will follow the first 7 slides. Print using 2 PowerPoint slides back to back. This worksheet will keep students on task during the presentati
Subjects:
Grades:
6th - 9th
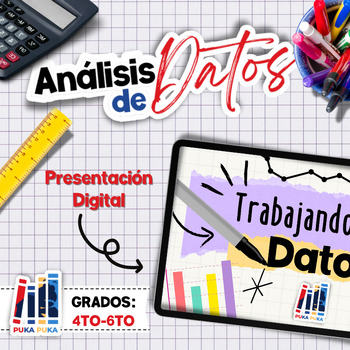
Presentación Digital: Trabajando con Datos (Gráficas y Análisis de Datos)
¿Estás listo para sumergirte en el fascinante mundo de los datos y aprender a transformarlos en información valiosa? ¡Nuestra completa y atractiva presentación es la herramienta perfecta para ti!¿Qué encontrarás en nuestra presentación?*28 diapositivas ("slides") con información acerca de:Los tipos de gráficas (barra, lineal o puntos, pictográfica, circular).Las partes de una gráfica (ejes, variables, título, leyenda, etc.).Descripción de los tipos de gráficas.Y más...Si tiene algún comentario o
Grades:
4th - 6th
Types:
Also included in: Bundle: Trabajando con Datos (Gráficas y Análisis de Datos)
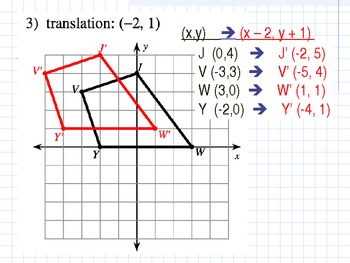
Translation (Transformation of Shapes)
This lesson is about the translation of a point/figure. Examples of open response questions with answers are included.
All problems are designed to be answered with a graphic organizer I designed called FICA (Formula, Insert, Calculate, Answer) to solve an open response question. Students are to arrange their answer similar to the quadrants of a coordinate grid.
Quadrant I Formula: What is given in the problem? What mathematical rules apply to this problem?
Quadrant II Insert: What numeric va
Grades:
7th - 10th
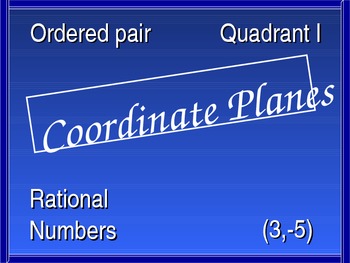
Common Core Standards Geometry, Number Sense, Coordinate Planes Handout
This PowerPoint lesson is very comprehensive and student involvement is significant. The following areas will be covered: understanding the coordinate plane, plotting points, reflection, dilation, integers, absolute value, rational numbers, perimeter, and area. Handouts with answers will support each part of this lesson.
Common Core State Standards are: Geometry 5.G 1 & 2,
6.NS 5-8, and 7.NS 1
Subjects:
Grades:
5th - 7th
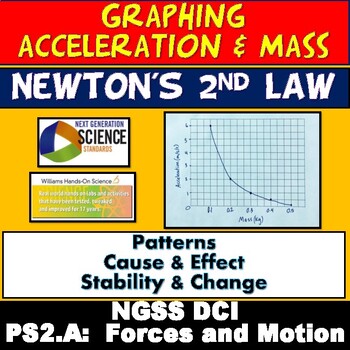
NGSS PS2.A: Forces and Motion Graphing Acceleration vs Mass Cause & Effect
If you are teaching your students how to understand graphs and NGSS Disciplinary Core Idea PS2.A: Forces and Motion, this resource is a great scaffold or assessment! Students discover that as more mass is added to an object, the acceleration decreases demonstrating Newton’s 2nd Law. The graph they make demonstrates that there is an inverse relationship between mass and acceleration and that acceleration is dependent on mass.This resource is great as a warm up/bell ringer, homework or sub plan.Ta
Subjects:
Grades:
6th - 12th
NGSS:
MS-PS2-2

Transformations of y=x2 in Vertex Form - Organizer and Presentation
This one page graphic organizer (pdf) summarizes the transformations on the quadratic y=x2 in vertex form by looking individually at influence the values of a, h, and k have on the final parabola, using the acronym haak. The organizer can be used on its own or paired with the matching presentation (pdf).Originally created for my grade 10s (Ontario's MPM2D), this resource is also suitable for Ontario's MFM2P, MBF3C, MCF3M, and MCR3U courses, or any course where the vertex form of the quadratic r
Grades:
9th - 11th
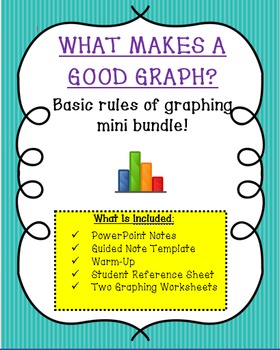
What Makes A Good Graph? Basic Graphing Rules & Practice Mini Bundle
In this mini bundle students will review what makes a good graph. This bundle includes everything you need to review in order to construct a bar and line graph. In addition to creating bar and line graphs, students will have the opportunity to practice graph interpretation not only using bar and line graphs but also pie charts, line plots, and histograms.
The PowerPoint presentation is accompanied with a quick and easy guided note sheet that is color-coded to make the note-taking process ea
Subjects:
Grades:
5th - 7th
Coordinate Planes
This can be used as independent practice or whole group instruction. This is great practice for 5th grade math when learning about coordinate planes.
Grades:
5th
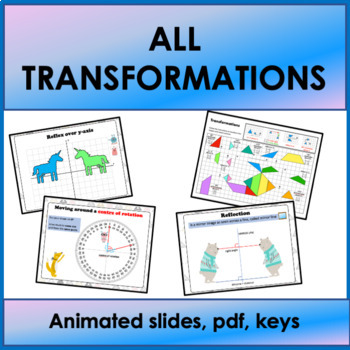
Transformations Geometry BUNDLE
Everything you need to teach or review transformations: reflection, rotation, translation or enlargement. Save your time and spend it with your loved ones.This bundle includes:- Animated slides- PDF worksheets- PDF Reveal the picture handouts- Review BINGO- Answer Keys
Subjects:
Grades:
6th - 8th
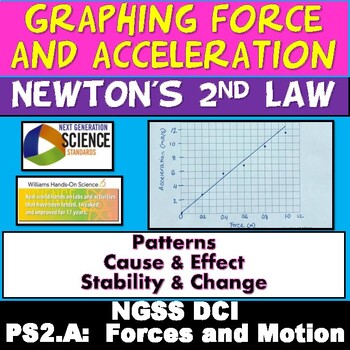
NGSS PS2.A: Forces and Motion Graphing Acceleration vs Force Cause & Effect
If you are teaching your students how to understand graphs and NGSS Disciplinary Core Idea PS2.A: Forces and Motion, this resource is a great scaffold or assessment! Students discover that acceleration of an object is dependent on the amount of force applied to it. This resource is great as a warm up/bell ringer, homework or sub plan. This resource includes the following:-Student Handout-Key-Editable PowerPoint for teacher tips, link to Newton’s 2nd Law information, classroom instructions and pa
Subjects:
Grades:
6th - 12th
NGSS:
MS-PS2-2
Algebra Power-point: Solving Quadratic Equations by Graphing with GUIDED NOTES
The following lesson covers "Solving Quadratic Equations by Graphing".
* Students begin by reviewing Standard Form for a Quadratic Equation
* Students learn where to locate the solutions to a Quadratic Equation on the Cartesian Plane.
* Students learn three inter-changeable ways to refer to the solutions to a Quadratic Equation.
* Students learn the steps necessary to find the solutions of a Quadratic Equation
* Students learn and explain in their own words what the graph of a Quadra
Subjects:
Grades:
8th - 11th, Higher Education, Adult Education
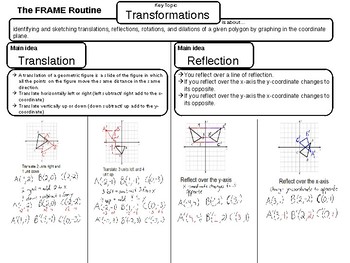
Transformations Notes SOL 7.7 and 8.7
7.7 The student will apply translations and reflections of right triangles or rectangles in the coordinate plane.8.7 The student will a) given a polygon, apply transformations, to include translations, reflections, and dilations, in the coordinate planeNotes includes translations, reflections over the x and y axis, dilations by scale factors of whole number and fractions, and rotation of 90 and 180 degrees clockwise and counter clockwise.
Subjects:
Grades:
6th - 9th
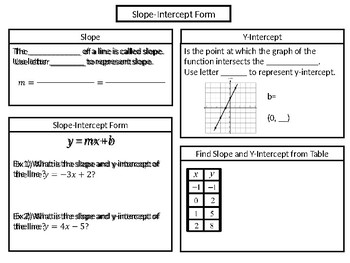
Slope-Intercept Form Notes SOL 8.16 a,b,d
--> 8.16: The student will a) recognize and describe the graph of a linear function with a slope that is positive, negative, or zero; b) identify the slope and y-intercept of a linear function given a table of values, a graph, or an equation in y = mx + b form; d) graph a linear function given the equation in y = mx + b form.
Grades:
6th - 9th
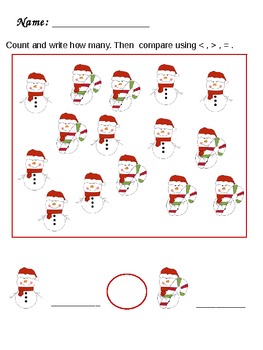
Christmas Math PreK-1st
Christmas Math
* 2 Graphing Activities and Recording Sheets (The students will count and graph the number of objects. Then they will Compare the numbers.This can be used as a hard copy for each child to complete or laminate the graphs and put in a center. Then each child can fill out the half sheet to record their graphing.)
* Santa Number Cards 1-10 ( Can be used with Number Talks or use them in a Math center to count and match the number)
* 2 Activities to Count and Compare
* 3 Activities
Subjects:
Grades:
PreK - 1st
Types:
House Makeover, Area, Ratios, Proportions, Student Handouts, Real-World
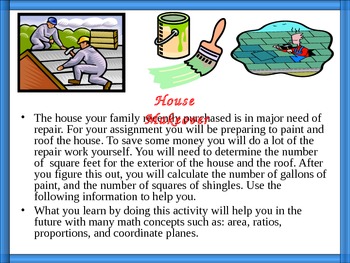
Here is a PowerPoint lesson that covers several Common Core Standards. It is a real-world activity which is fun, interactive, and creative in solving mathematical problems. Using the handouts, students will be actively involved in finding area of rectangles and triangles. In addition,they will solve proportions to determine actual measurements of a house.Finally they will calculate the amount of paint and shingles needed for the project.
Note: To advance the presentation, I use a wireless mou
Subjects:
Grades:
6th - 7th
Graphing Inequalities - The Notebook Curriculum Lesson Plans
The Algebra concepts in this PowerPoint focus on graphing inequalities using a number line. 14 different graphing problems exemplify how to use each type of inequality sign to determine if the point graphed is open or closed and which way to draw the solutions arrow. Reading the graphs and writing out solutions using the student’s own words and phrases is also heavily stressed and practiced.I wrote The Notebook Curriculum is a versatile framework for any subject, focused on helping teachers esta
Subjects:
Grades:
6th - 12th

Transformations of Quadratic Functions Practice (PowerPoint and Handout)
Graphing Quadratics that have been transformed from the parent function. This fully animated review shows step by step how to graph these quadratic function on the coordinate plane by identifying any Translations, Reflections, and Dilations that are shown in the equation.This review consists of a warm up set, followed by 8 quadratics to graph, and 3 using only the table.
Subjects:
Grades:
8th - 12th
CCSS:
Showing 1-24 of 80 results


