20 results
5th grade graphing handouts for Microsoft PowerPoint
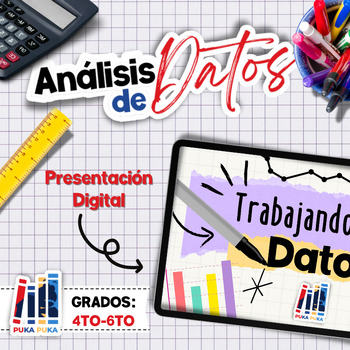
Presentación Digital: Trabajando con Datos (Gráficas y Análisis de Datos)
¿Estás listo para sumergirte en el fascinante mundo de los datos y aprender a transformarlos en información valiosa? ¡Nuestra completa y atractiva presentación es la herramienta perfecta para ti!¿Qué encontrarás en nuestra presentación?*28 diapositivas ("slides") con información acerca de:Los tipos de gráficas (barra, lineal o puntos, pictográfica, circular).Las partes de una gráfica (ejes, variables, título, leyenda, etc.).Descripción de los tipos de gráficas.Y más...Si tiene algún comentario o
Grades:
4th - 6th
Types:
Also included in: Bundle: Trabajando con Datos (Gráficas y Análisis de Datos)
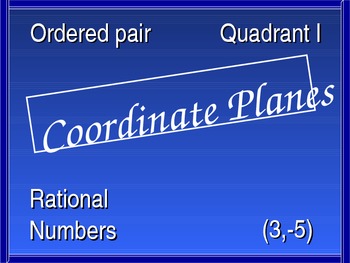
Common Core Standards Geometry, Number Sense, Coordinate Planes Handout
This PowerPoint lesson is very comprehensive and student involvement is significant. The following areas will be covered: understanding the coordinate plane, plotting points, reflection, dilation, integers, absolute value, rational numbers, perimeter, and area. Handouts with answers will support each part of this lesson.
Common Core State Standards are: Geometry 5.G 1 & 2,
6.NS 5-8, and 7.NS 1
Subjects:
Grades:
5th - 7th
Coordinate Planes
This can be used as independent practice or whole group instruction. This is great practice for 5th grade math when learning about coordinate planes.
Grades:
5th
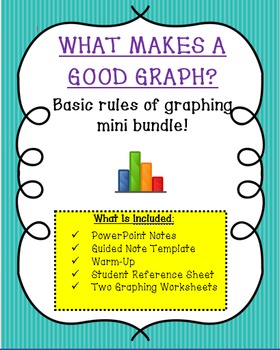
What Makes A Good Graph? Basic Graphing Rules & Practice Mini Bundle
In this mini bundle students will review what makes a good graph. This bundle includes everything you need to review in order to construct a bar and line graph. In addition to creating bar and line graphs, students will have the opportunity to practice graph interpretation not only using bar and line graphs but also pie charts, line plots, and histograms.
The PowerPoint presentation is accompanied with a quick and easy guided note sheet that is color-coded to make the note-taking process ea
Subjects:
Grades:
5th - 7th
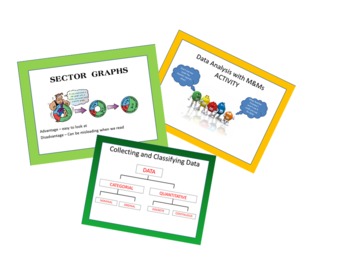
Data, sector graphs, line graphs, histograms, poly histograms, frequency table
This is a powerpoint designed to aid you as a mathematics teacher but also reduce your workload. The following chapter of work includes powerpoint presentations to use as examples when teaching students, ICT integration of the relevance of Data, and a hands on activity
Sections included:
- The Divided Bar Graph
- Column Graph
- Sector Graph
- Line Graph
- Tables and Charts
- Frequency Distribution Tables
- Histograms and Frequency Polygons
- Dotplots and Stem and Leaf Plots
- Collecting and Cla
Grades:
5th - 9th
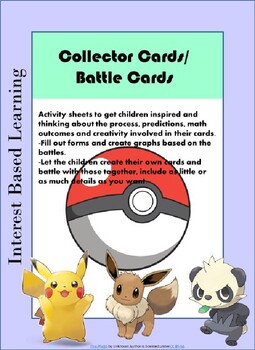
Learning through trading cards - Pokemon
Pokémon is something the children talk about all the time. They spend a lot of money and time on their collections and enjoy battles. This is a great opportunity to get them excited about a learning exercise! These worksheets can be used with more then just Pokémon as they are not on-brand and allows for more individual adaptation to suit your needs!There are battle record sheets (4 different ones), card identification sheet to be filled in, charts to assess the strength of the cards they choos
Subjects:
Grades:
1st - 8th
Types:
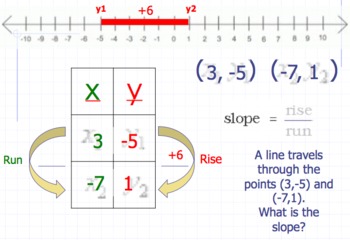
Teaching Slope of a Line using Graphic Organizers
Included:
Before Class Works and Exit Tickets in Open Response Format
Graphic Organizers to calculate slope on a graph, table, and from an equation
Perfect for ELLs and Resource
Subjects:
Grades:
5th - 10th

Inquiry Unit PowerPoint
This 41 slide Inquiry Unit PowerPoint comes complete with a hyperlinked main menu: Scientific InstrumentsSpring ScaleTriple Beam BalanceBarometerSling psychrometer Scientific Investigation QuantitativeQualitativeInferenceCompiling DataData TableIndependent VariablesDependent VariablesGraphsPictographBar CircleLineDrawing a Line GraphInterpreting a GraphClassifying Objects and OrganismsDichotomous KeyTechnological DesignControlled ExperimentLab SafetySymbolsScenarios
Subjects:
Grades:
PreK - 12th, Higher Education, Adult Education
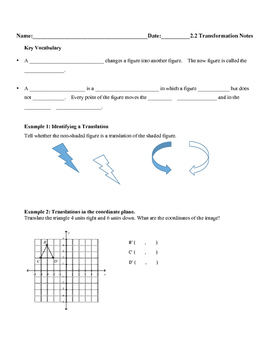
Transformation Notes Bundle
These are a set of notes that I have provided to my students to follow along with the PowerPoint Presentation. The PowerPoint Presentation could be found at this link: https://www.teacherspayteachers.com/Product/Transformations-Presentation-2721253
**Please note, the answer key is only provided in the PowerPoint presentation. However, they are pretty easy to get without having the PPT.
The topics in this bundle include:
Translating objects (on and off the coordinate plane)
Rotating objects (on
Grades:
5th - 8th
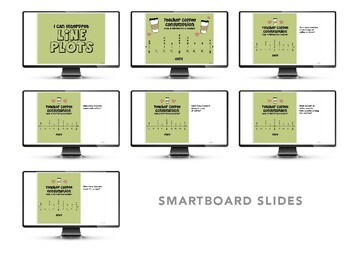
Interpreting Line Plots
Slides for class discussion. Great for reinforcing how to read line plots. Includes small printable version of the line plot for students to use at their desk. I found its nice for students who have trouble reading from the board or like to mark it up to have a printed version along side them.
Grades:
5th
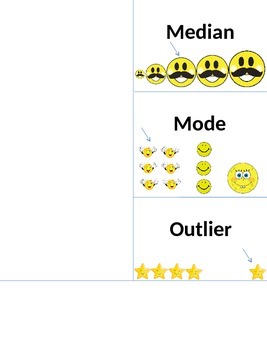
Median, Mode, and Outlier Foldable
This foldable gives step by step directions for finding median, mode and outliers of a data set.
Subjects:
Grades:
3rd - 5th
Types:

Graphing Activity Integrated with Children's Literature
I like to read the children's book, The Three Little Pigs, the Wolf's Side of the Story, to my class before we graph this picture. The story can be found on the internet, but you may want to by the book instead. Then, you may show the class the pictures. All ages enjoy this book.

Editable Bar Graph Tutorial
Students can use this presentation as a resource for making a bar graph.
Grades:
4th - 8th
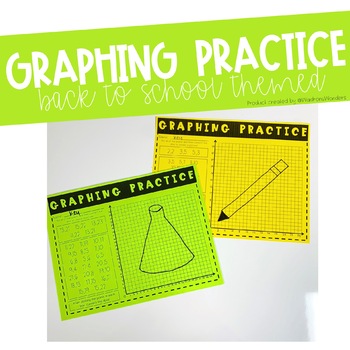
Graphing Practice - Back to School Themed
Enjoy practicing graphing with the BEAKER and PENCIL graphs! have the students graph the points and connect their dots to make sure they plotted the points correctly!Happy GRAPHING!
Subjects:
Grades:
4th - 12th
Types:

Bar Graph Tutorial
Students can use this presentation as a resource for making a bar graph.
Grades:
4th - 8th

Are the Polygons Congruent Presentation
Objective: I can define congruence.I can Identify Congruent ShapesKey Vocabulary:CongruentPolygon
Grades:
4th - 10th
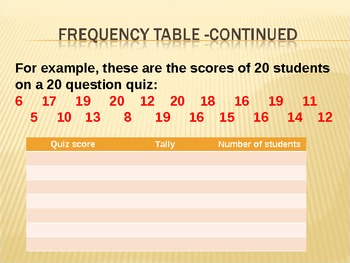
Frequency table and pie chart powerpoint
A PowerPoint presentation presenting data to the students in order to create frequency table and pie chart.
Subjects:
Grades:
5th - 6th

Editable: When Finished Early Poster
This is ENTIRELY editable! I had this printed as a poster size in PP, but you can also make them mini handouts for every student! It came in handy when a student would ask what they should do. "Look at the "Finished Early" poster!"
Subjects:
Grades:
1st - 8th
Types:

Angles
This is a short powerpoint about angles. If you like my product please rate me and leave a comment. Thanks for visiting my store!
Subjects:
Grades:
5th - 10th, Staff
Showing 1-20 of 20 results


