TPT
Total:
$0.00

Stained Glass Slope Graphing Linear Equations Slope Intercept Form

Rated 4.82 out of 5, based on 768 reviews
4.8Ā (768 ratings)
;
Grade Levels
8th - 9th, Homeschool
Standards
Formats Included
  • PDF
Pages
11 pages
$2.40
List Price:
$3.00
You Save:
$0.60
$2.40
List Price:
$3.00
You Save:
$0.60
Share this resource
Report this resource to TPT

What educators are saying

I love using this resource for my 8th Grade Math Small groups, the students love the activity because once they complete the "math" part of it and graph it I let them trace the design on a clear plastic plate with Sharpies to make a stained-glass ornament.
Highly engaging resources for students! Greatly appreciated the cross-curricular connection to appeal to their strengths and interests! Thank you!

Description

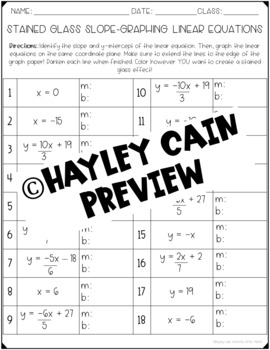
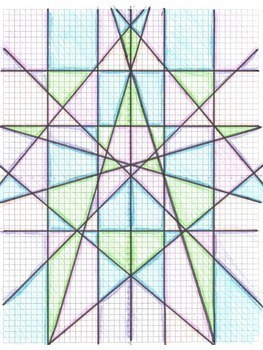
Students will graph 18 equations written in slope-intercept form. All four types of slope are included(positive, negative, undefined, and zero). They will then darken the lines and color however they like creating a picture with a stained glass effect. This is a great activity that goes beyond the worksheet! You can save paper by printing the instructions on one side and the graph paper on the other!

This resource includes:

  • Student instructions page
  • Graph paper with the numbers and x- and y-axis labeled
  • Graph paper without the numbers or x- and y-axis labeled
  • An outline of the graphed lines
  • A colored example of the end result
  • A blank copy for your higher-level learners to create their own equations and designs

Options for using this resource:

This makes a great classroom or bulletin board display! Students get practice after learning about graphing linear equations and can be creative with their end results. This can be left as substitute plans as well.

My higher-level learners love creating their own designs by writing their own linear equations(blank version is included)! This is great for differentiation! It's amazing the designs students can come up with!

You might also be interested in these other resources:

"I Have, Who has..?" Finding Slope from a Graph Game

Slope between Two Points Matching Puzzle

Slope Review Color By Number Practice

Writing Linear Equations Task Cards digital GOOGLE Slide Version

Finding Slope Given Two Points Puzzle

Common Core Aligned

8.EEB6, 8.FA3, 8.FB4

Don't forget that leaving feedback earns you points toward FREE TPT purchases!

Ā© Hayley Cain (Activity After Math) Please note - this resource is for use by one teacher only. Additional teachers must purchase their own license. If you are interested in purchasing several licenses, please contact me. Thank you for your feedback and Happy Teaching!Ā 

activityaftermath@gmail.com

ā˜…Let's be Social

Follow me on Instagram

Follow me on Facebook

Check out my Blog

Total Pages
11 pages
Answer Key
Included
Teaching Duration
N/A
Report this resource to TPT
Reported resources will be reviewed by our team. Report this resource to let us know if this resource violates TPTā€™s content guidelines.

Standards

to see state-specific standards (only available in the US).
Use similar triangles to explain why the slope m is the same between any two distinct points on a non-vertical line in the coordinate plane; derive the equation š˜ŗ = š˜®š˜¹ for a line through the origin and the equation š˜ŗ = š˜®š˜¹ + š˜£ for a line intercepting the vertical axis at š˜£.
Interpret the equation š˜ŗ = š˜®š˜¹ + š˜£ as defining a linear function, whose graph is a straight line; give examples of functions that are not linear. For example, the function š˜ˆ = š‘ Ā² giving the area of a square as a function of its side length is not linear because its graph contains the points (1,1), (2,4) and (3,9), which are not on a straight line.
Construct a function to model a linear relationship between two quantities. Determine the rate of change and initial value of the function from a description of a relationship or from two (š˜¹, š˜ŗ) values, including reading these from a table or from a graph. Interpret the rate of change and initial value of a linear function in terms of the situation it models, and in terms of its graph or a table of values.

Reviews

Questions & Answers