18 results
4th grade graphing activities for Microsoft Excel

Ordered Pairs Graphing Coordinate Plane Pixel Art Math | 5 Images | Editable
Ordered pairs mystery pixel art with a doubles / perfect pairs theme! Have students practice finding the location of a coordinate pair on a graph to AUTO-GENERATE one of 5 pixel art images in Google™ Sheets (or Microsoft Excel™) plus a "secret message."★ Low Prep: Just assign the sheet in Google Classroom. Each sheet includes all 5 images; students click the tabs at the bottom to advance to the next pixel image. There are 12 math problems per image to solve.★ Differentiated: Includes 4 versions
Grades:
4th - 5th
Types:
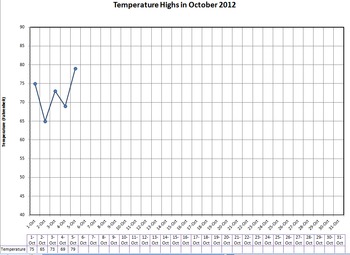
Graph Daily Temperature - with handout
Lots of downloads, are there any comments or votes for me? :)
Type in the daily temperature on your computer with your students and it will automatically graph it for you as you type. You can pre-print the monthly graph for everyone in your class and they can follow along and graph with you. I use it with calendar math or other daily activities.
Great for explaining the scales of a graph and practicing accuracy in graphing and using rulers to connect lines. Look for trends in weather and a
Subjects:
Grades:
3rd - 6th
Types:
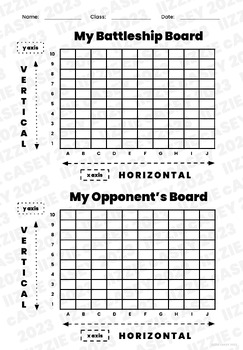
Coordinate Grids for Battleship and Spreadsheet Practice
I used this resource to teach 2nd and 3rd graders how spreadsheets and coordinate grids work! We played Battleship with them.
Subjects:
Grades:
2nd - 6th
Types:
Spreadsheet Interactive Lesson {6.SP.4}
Looking for step by step instructions for interactive note booking using spreadsheets? This file is exactly what you need! There are complete instructions for notebook organization and how students use a self assessment stop light graphic organizer to communicate their comprehension of the lesson. This lesson includes complete instructions and student black line masters. There are also pictures of sample pages. My student's favorite part of this lesson is entering the data on computers and creat
Subjects:
Grades:
4th - 8th
Types:
CCSS:
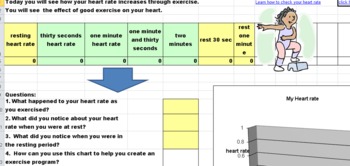
How can exercise effect your heart rate? -formulas, hyperlinks, andvideo
This spreadsheet is filled with an interactive graph based on real data that your students put into the spreadsheet. Their are hyperlinks for students to use (video and text for differentiation) to learn how to check their pulse. This would be a great lesson to complete for a heart healthy unit, or just to teach kids to stay active during wintery weather.
There are follow up questions that are at the bottom of the spreadsheet that will help them analyze their own data. Kids will love this les
Grades:
2nd - 6th
Types:

Graphing in Excel with Skittles Digital
This is a unit on graphing using Skittles. Excel is a powerful tool for graphing since it is easy to use and simple to change your graph. It gives step by step instructions to the students so they can graph easily.Students love graphing with Skittles and even learning information on the Skittles website!This is by CC Fisher.
Grades:
3rd - 6th
Types:
Also included in: Microsoft Excel Bundle of Treasures! Digital
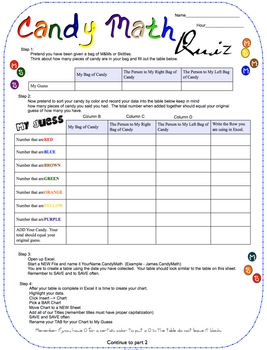
Candy Math Quiz for Grades 3-8
This quiz is a fun way to assess your students in their chart making skills in Excel along with their problem solving skills.
Part 1 of the quiz students are to pretend they have been given a bag of candy. They are to create a table then a chart with their data.
Part 2 of the quiz you give your students candy and this time they have to record the actual amount and make a table and a chart.
Part 3 of the quiz test basic formula writing.
Common Core - 3.MD.3. Draw a scaled picture graph and
Subjects:
Grades:
3rd - 9th
Types:

Excel Graphing Halloween Trick-or-Treat
Homework?? On Halloween?? Seriously??!!This Halloween Trick-or-Treat Excel Project, updated July 2018, can be an engaging way to:* integrate technology* introduce, extend, or enrich a math topic of study* introduce students to creating sheets and charts using Excel* give students a chance to graph their Halloween goodies collected in a way that’s real and relevant! This classroom-tested Halloween Excel project file includes: * student project directions sheet, in checklist form * rubric to score
Subjects:
Grades:
3rd - 6th
Types:
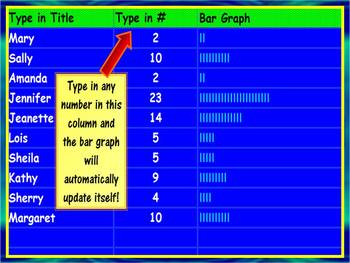
Automatic Bar Graph Maker
This activity can be used to teach students of all ages about bar graphs. This spreadsheet can be used to introduce the concept of bar graphs to elementary students as well as implemeted by mid-level & high school students in lab reports and/or presentations. It is extremely quick and easy to use! Just type in a set of numbers and it automatically creates a simple bar graph. And check out my other graph templates for line and bar graphs! They are definately worth your time!
Grades:
K - 12th
Types:
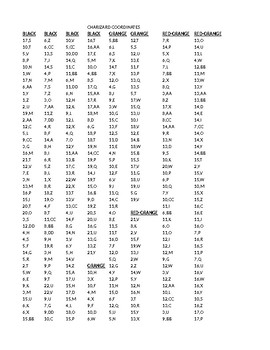
Charizard Coordinates
This is compatible with the 30x30 grid. This is Charizard, a rather large and more time consuming coordinate sheet. The kids will enjoy making this one small or large scale. Warning: if made with 3x3 inch squares, this pixel project will stand about 5 feet tall and 6-7 feet wide.
Subjects:
Grades:
1st - 12th
Types:
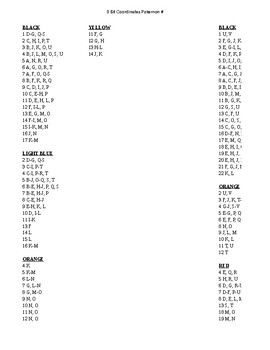
Pokemon coordinates
This excel workbook contains 6 coordinate pages for 6 different Pokemon characters, to be used with the 30x30 grid. Characters include Squirtle, Raichu, and Bulbasaur, to name a few.
Subjects:
Grades:
1st - 8th
Types:

Graph Daily High and Low Temperatures - with handout
Per a few requests, I have added temperature lows as well as the temperature highs.
Type in the daily temperature on your computer with your students and it will automatically graph it for you as you type. You can pre-print the monthly graph for everyone in your class and they can follow along and graph with you. I use it with calendar math or other daily activities.
Great for explaining the scales of a graph and practicing accuracy in graphing and using rulers to connect lines. Look for tre
Subjects:
Grades:
4th - 7th
Types:
Tracking Daily Weather for Excel and Numbers
Have your students record the daily weather to look for trends across the year. Use the information collected to make predictions about the weather. This product is available as an Excel spreadsheet and as a Numbers file.
Subjects:
Grades:
1st - 8th
Types:
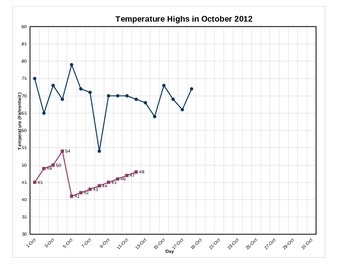
Graph Daily High and Low Temperatures - with handout
Per a few requests, I have added the capability to graph the low temperatures as well as the high temperatures.
Type in the daily temperature on your computer with your students and it will automatically graph it for you as you type. You can pre-print the monthly graph for everyone in your class and they can follow along and graph with you. I use it with calendar math or other daily activities.
Great for explaining the scales of a graph and practicing accuracy in graphing and using rulers t
Subjects:
Grades:
4th - 7th
Types:
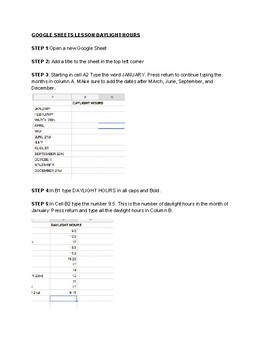
Google Sheets Beginner Lesson
This activity will give students an understanding of basic Google Sheets functions such as, adding data to cells and inserting a chart based on the data. Great for beginners!
Subjects:
Grades:
3rd - 5th
Types:
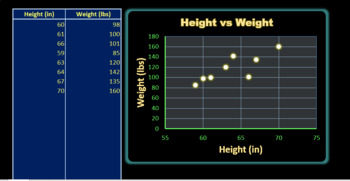
Interactive Excel Scatter Plot Maker - Editable
With this document, you can create scatter plots in real time with your class. The file uses Microsoft Excel's graphing ability to make a scatter plot. All you have to do is name the axes, add data (up to 500 pairs of numbers), and then name your graph. The file is editable in Excel and can be altered in any desired way (colors, format, etc.). To name the axes, edit the title at the top of the data table and the graph will automatically update.To name the graph, double click "[Title]" and enter
Grades:
4th - 10th
Types:
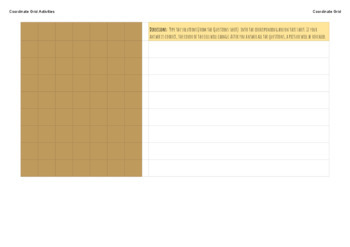
Coordinate Grids with Google Sheets (or Excel) and Legos (Free)
In the free version of this activity, you will get a preview of a coordinate grid that can be used in the classroom as well as a list of Legos that can be used to recreate the image revealed in the grid.The full priced version contains all the math problems needed to unlock the image. When the correct solutions are typed into the coordinate grid (in Google Sheets or Excel), the cells will change color. When all problems have been solved, an image will appear.The Lego images in the product are
Subjects:
Grades:
3rd - 5th
Types:
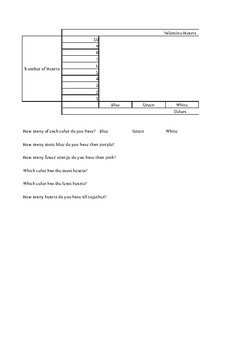
Candy Hearts Bar Graphing
During the Valentine's Day season, students each get a miniature box of candy hearts. They must sort them by color and then graph the number of each color they have.
Subjects:
Grades:
K - 6th
Types:
Showing 1-18 of 18 results


