31 results
High school statistics cultural activities by TpT sellers for TpT sellers
Fun Statistics Research Survey Project | Standards-Based | Math 9 BC
This is a great math project to add to a unit on data and statistics. It is a great way for students to do a project on something that is important to them and they get a chance to present their individual work, which is rewarding.Description:Tell students they will be conducting a survey on. They should pick a topic and question that has some significance to them, their family, or their culture. Students will:Write a research question and a prediction. Describe the population, sampling techni
Subjects:
Grades:
7th - 11th
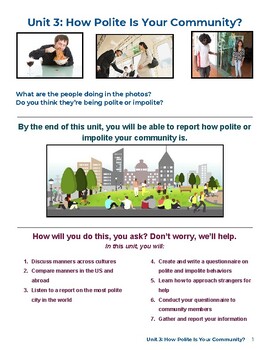
Project-based Unit on Polite/Impolite Behaviors
This project-based unit on polite behaviors is an engaging and interactive way for ESL students to build their communication skills. Other skills and systems are targeted in the unit, such as reading to make predictions and writing a hypothesis. Depending on the dynamics of the class and instructor, this unit can be completed in 1-2 weeks.Although students are expected to conduct surveys in public and present their findings, the tasks can be adapted to suit the class's comfort zones and needs. F
Grades:
9th - 12th, Higher Education, Adult Education
Types:
Which Quarterback is the G.O.A.T.? - Using Statistical Calculations
Note: This is an upgraded version of the Statistical Analysis Using Football (QB) Stats. If you have previously purchased this resource please email me and I will send you the updated version.This project has students calculate percents, averages, and ratios, as well as create scatterplots, box and whisker plots, and histogram (bar graphs) based on their calculations.Google slideshow includes 12 well know Hall of Fame quarterbacks including Joe Namath, Roger Staubach, Terry Bradshaw, Joe Montana
Subjects:
Grades:
6th - 9th
CCSS:
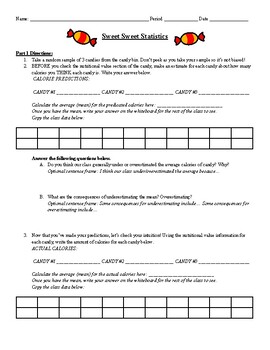
Halloween / Fall Statistics Class Activity for Box Plots and Five Number Summary
Hello!If you're looking for a fun and engaging activity for your Statistics Class this Halloween or fall season, this activity is great! My students enjoy getting the opportunity to eat candy as they work on some real-world statistical applications. The activity requires students to collect data, share data with their peers, and analyze the data. They will be working on creating a five number summary and analyzing/drawing box plots. You will need to purchase candy for this activity. Please reach
Subjects:
Grades:
9th - 12th, Higher Education
CCSS:
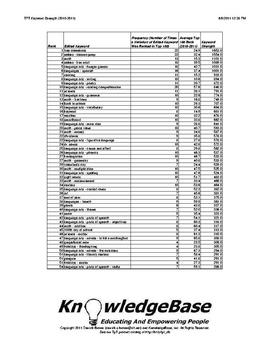
TPT KeyWord Strength Index (2010-2011) - Downloadable Spreadsheet!
What are the strongest keywords on TpT?
1. free downloads
2. Deanna Jump
3. math
Neither #1 nor #2 are surprises, but #3 (math) was certainly a surprise to me!
This report analyzes TpT's 2010-2011 keywords using a measure called "keyword strength".
The measure is based on a keyword's average rank, as well as the number of times it appeared in the 2010-2011 "Top 100" TpT search engine rankings.
This can be a valuable tool to help sellers understand TpT's marketplace supply and demand!
The P
Subjects:
Grades:
PreK - 12th, Higher Education, Adult Education, Staff
White Supremacy and Confederate Monuments Timeline Activity
This is an activity that uses data collected by the Southern Poverty Law Center tracking the use of Confederate symbols in the form of monuments, courthouses, schools, and other public amenities, including parks, highways and holidays.
The activity takes place in 3 parts:
The first part is that students assemble and label a timeline that tracks the rise of Confederate symbols from 1860 to the present day (2016.)
In the second part, students match dates to 10 different events in Civil Rights h
Subjects:
Grades:
5th - 12th
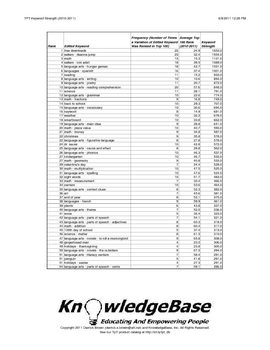
TPT KeyWord Strength Index (2010-2011) - Downloadable PDF!
What are the strongest keywords on TpT?
1. free downloads
2. Deanna Jump
3. math
Neither #1 nor #2 are surprises, but #3 (math) was certainly a surprise to me!
This report analyzes TpT's 2010-2011 keywords using a measure called "keyword strength".
The measure is based on a keyword's average rank, as well as the number of times it appeared in the 2010-2011 "Top 100" TpT search engine rankings.
This can be a valuable tool to help sellers understand TpT's marketplace supply and demand!
The P
Subjects:
Grades:
PreK - 12th, Higher Education, Adult Education, Staff

Social Justice in Math BUNDLE--NEW
Here are SIX middle school worksheets that incorporate the concepts of social justice. Teachers can model equality and equity while doing math. Here is a way to get started! NEW WORKSHEETS ADDED! (each worksheet is also available individually).
Subjects:
Grades:
6th - 10th
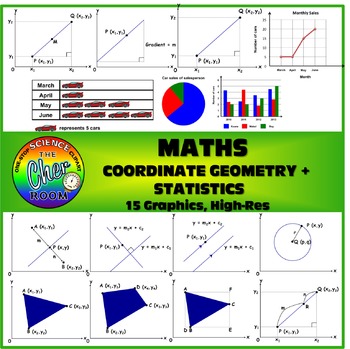
MATH Clipart: Coordinate Geometry and Statistics
15 Graphics on Coordinate Geometry and Statistics
You'll find diagrams that illustrates the following:
Gradient
Mid Point
Point at a ratio
Area of geometry
pi chart
pictogram
bar chart
line graph
This product is allowed for both personal and commercial use, but credit must be given to my store: https://www.teacherspayteachers.com/Store/The-Cher-Room
Subjects:
Grades:
7th - 12th
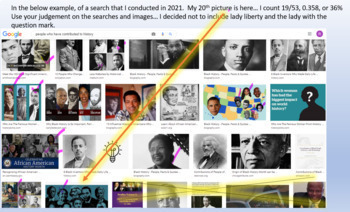
Women's History Month Probability Project
Students learn about suffrage and representatio of women. Students conduct Google searches on favorite subject, sport/hobby, future career and find the probability of a woman appearing in the first 20 images. Students make conjectures about representation of women in those areas. Students identify women they admire and create a video summarizing their findings.Can be adapted to images for African Americans for Black History Month, Hispanic Americans for Hispanic Heritage Month, etc.
Subjects:
Grades:
6th - 12th, Adult Education, Staff
Dice Bulletin Board Letters
These dice themed alphabet letter will brighten up your bulletin board display. All 26 alphabet letters are included in an uppercase font, as well as numerals 0-9 and punctuation. Letters are approximately 6 inches tall. Just print what you need and enjoy. Be sure to check out my other fun, themed letters in my store.
Subjects:
Grades:
PreK - 12th, Higher Education, Adult Education, Staff
Statistics Vocabulary TEKS Aligned
This product includes several vocabulary words for a statistics unit. There are three graphs that will be able to cut and match, along with definitions of vocabulary words.
This is aligned with the Texas TEKS
6.12B 6.12C 6.12D 6.13B
I hope this can be useful to you and your students!
Stop by my store for some free fonts!
S&S Designs
https//www.teacherspayteachers.com/Store/S-And-S-Designs
Subjects:
Grades:
6th - 9th
Probability Scavenger Hunt (with a Finale about Activist Medgar Evers)
Students will love getting out of their seats to solve problems related to permutations and probabilities of independent and dependent events! The self-checking nature of this scavenger hunt makes it super-easy to run this activity and to tell if students understand the content. You don't have to do any work - just print the signs and hang them. The student solution sheet includes an interesting historical application related to Medgar Evers - students will determine the probability of his m
Subjects:
Grades:
6th - 12th
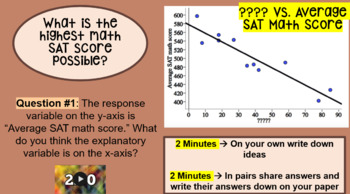
Stats: Inequities in Student Achievement & Poverty (PPT, NOTE SHEET-KEY, CFU)
Empower students to be able to interpret relevant data and make informed decisions based upon that data.Activity Based Learning where students experience first and then formalize their thoughts later.Extremely relevantMath discourse- a lot of room for conversation and critical thinkingProblem solving, reasoning, representation, communication, and connections … Oh my!When and Whereo Pre-Algebra/Algebra 1/Algebra 2: Linear Functions and Equationso Data and Statistics: Analyzing Two-Variable Datao
Subjects:
Grades:
9th - 12th
CCSS:
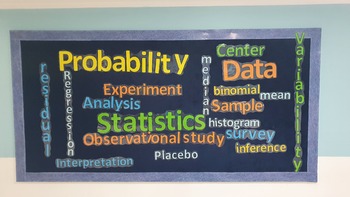
Statistics / AP Statistics Word Cloud Bulletin Board
The product is a word cloud for Statistics / AP Statistics.It is a PDF documents of the letters of different sizes forming the words shown in the bulletin board. ( few more words are in the document but not on the board). The colored used in the document are 5 named as color 1, color 2 .... at the bottom of the page. You can choose your own colors.For time saving, use a cricut or similar device if available.Best of luck!
Subjects:
Grades:
11th - 12th, Higher Education, Adult Education
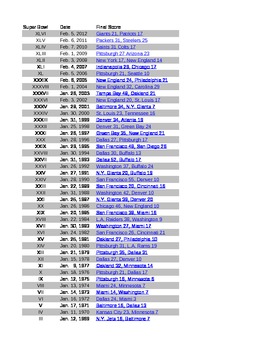
Is there a Correlation or Causation to football Scores
What does it really take to win a Super Bowl? During this activity you will explore the statistics behind winning and losing the game. make predictions and explain your data. correlation, causation, linear regression
Subjects:
Grades:
9th - 12th, Higher Education, Adult Education, Staff

MedAware Labels and Chart Kit Booklet
Always Know When, What, Why and How Medications are taken.
(Avoid under and overdosing prescription, generic and other drugs).
Subjects:
Grades:
PreK - 12th, Higher Education, Adult Education, Staff
Social Justice in Middle School Math #3
This is the third worksheet of word problems for middle school math that highlight some of the social justice issues that are being addressed around the country. This particular worksheet is predominantly percent and proportion problems. See my two previous worksheets for other math topics. Math teachers should not and cannot stand by and let Social Studies and ELA teachers discuss social justice. Students should hear the facts from all teachers, and be educated so that each student can form his
Subjects:
Grades:
6th - 10th
Also included in: Social Justice in Math BUNDLE--NEW
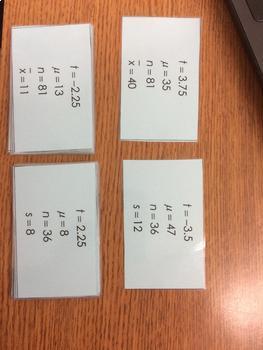
t-statistic "Find Your Match" Activity
PLEASE RATE! :) My Statistics students needed practice when they first learned how to calculate a t-statistic. I came up with this activity that requires students to work backwards using the t-statistic formula to either find the sample mean or the sample standard deviation.
Each student will have different numbers, but two of the cards will have the same sample mean and same sample standard deviation. Once the student solves for the missing statistic, they will walk around and find anothe
Subjects:
Grades:
11th - 12th
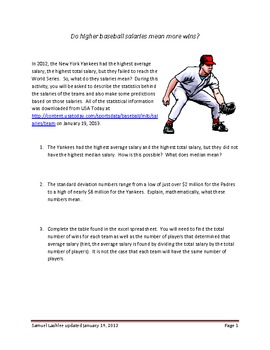
The Statistics of Baseball Salaries 2012
The statistics behind the salaries of the teams and also make some predictions based on those salaries. New York Yankees Philadelphia Phillies Boston Red Sox Los Angeles Angels Detroit Tigers Texas Rangers Miami Marlins San Francisco Giants St. Louis Cardinals Milwaukee Brewers White Los Angeles Dodgers Minnesota Twins Mets Chicago Cubs Atlanta Braves Cincinnati Reds Seattle Mariners Baltimore Orioles Washington Nationals Cleveland Indians Colorado Rockies Toronto Blue Jays Arizona Diamondbacks
Subjects:
Grades:
8th - 12th, Higher Education, Adult Education, Staff
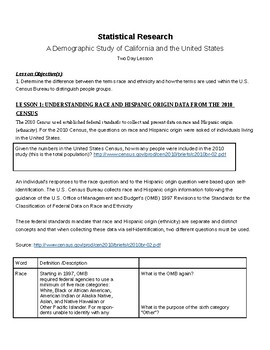
Statistical Analysis: U.S. Census Data Overview
This lesson uses data from the 2010 U.S. Census to allow students to access numbers and data in a social science classroom. The lesson is a 2 day mini-unit centered on working with charts, graphs, and tables (serves extremely well for SAT and ACT prep). This cross-curricular lesson draws meaningful parallels between math and social science, and the necessity of bringing these subjects together. The lesson uses a comparative look at Census data for California and the United States as a whole, but
Subjects:
Grades:
9th - 12th, Higher Education
Types:
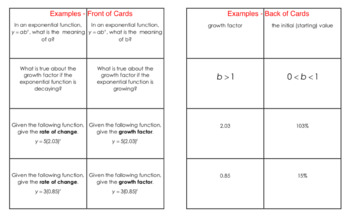
Exponential Models & Log Rules Activity
This activity allows students to quickly quiz one another (or even themselves) on exponential models and log rules. To be successful, students will need to know the meaning of each part of the exponential formula y=ab^x. Students will also need to be able to find the initial value, growth factor and growth rate from both an equation and a graph. Students will test their skills at converting a logarithmic equation to an exponential model and vice versa. There are a total of 32 different cards
Subjects:
Grades:
10th - 12th
CCSS:
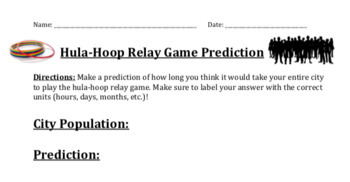
Equation of Line of Best Fit Activity (Hula-Hoop Relay Game)
This activity involves playing the hula-hoop relay game as a class to collect data. (You can find videos on youtube for demo/instructions of the game!) Students will use this data to predict how long they think it will take their town to play the game.The game:****You will need 1 hula-hoop to play this game!! (I got mine at the dollar store)****Students will start in a group of 3 and play the game, and someone will record the time it takes to play. Next, you will add another student to the group
Subjects:
Grades:
6th - 9th
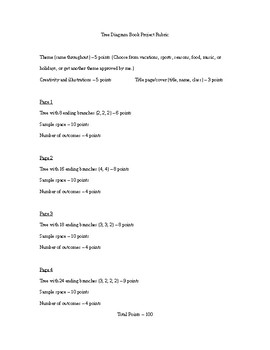
Tree Diagram Book Rubric
Students choose a broad topic and make 4 pages of tree diagrams with number of outcomes and sample spaces based on more specific parts of the broad topic. For example, students can choose Seasons as the broad topic and a different season for each page, or they can choose Types of Foods as the broad topic and a different type of food for each page. The categories and choices break down the topic into even more specific parts, and the choices make up the sets of branches in the tree.
Subjects:
Grades:
9th - 12th
Types:
Showing 1-24 of 31 results


