35 results
High school statistics webquests by TpT sellers for TpT sellers
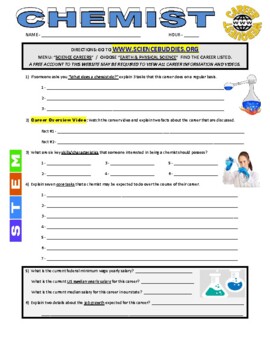
Science Career Webquest: Chemist (chemistry / STEM / industry / sub plans)
CAREER WEBQUEST : CHEMISTSUBJECT: SCIENCE, CAREERS, CHEMISTRY, STEM, COMPUTERS, DISTANCE LEARNINGGRADES : 9-12DISTANCE LEARNING: YES!SUB PLANS: YES!This internet assignment is designed to be used with www.sciencebuddies.org. Full directions for students to link to the correct page career are provided with the webquest.Important: Please be aware that a FREE account with the website may be required in order for students to view all videos and information connected with this career. Teachers should
Subjects:
Grades:
9th - 12th
Which Quarterback is the G.O.A.T.? - Using Statistical Calculations
Note: This is an upgraded version of the Statistical Analysis Using Football (QB) Stats. If you have previously purchased this resource please email me and I will send you the updated version.This project has students calculate percents, averages, and ratios, as well as create scatterplots, box and whisker plots, and histogram (bar graphs) based on their calculations.Google slideshow includes 12 well know Hall of Fame quarterbacks including Joe Namath, Roger Staubach, Terry Bradshaw, Joe Montana
Subjects:
Grades:
6th - 9th
CCSS:

Wisconsin Fast Plants Online Simulation Lab
This comprehensive worksheet has students evaluate genetics using the free online lab through Gizmos (this simulation is currently FREE with the creation of an account (which is also FREE). Students will explore:- tracking parentage based on F1 and F2 phenotypes- statistical analysis using Chi Squared calculations - gene linkage evaluation and gene mapping using recombination frequencies Perfect for remote learning! Everything is included for guided learning AND independent practice to really g
Subjects:
Grades:
9th - 12th, Higher Education, Adult Education, Staff
Types:
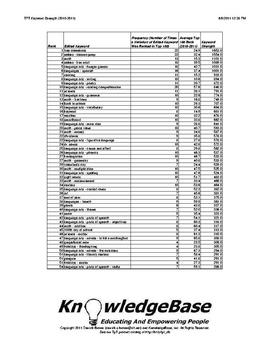
TPT KeyWord Strength Index (2010-2011) - Downloadable Spreadsheet!
What are the strongest keywords on TpT?
1. free downloads
2. Deanna Jump
3. math
Neither #1 nor #2 are surprises, but #3 (math) was certainly a surprise to me!
This report analyzes TpT's 2010-2011 keywords using a measure called "keyword strength".
The measure is based on a keyword's average rank, as well as the number of times it appeared in the 2010-2011 "Top 100" TpT search engine rankings.
This can be a valuable tool to help sellers understand TpT's marketplace supply and demand!
The P
Subjects:
Grades:
PreK - 12th, Higher Education, Adult Education, Staff
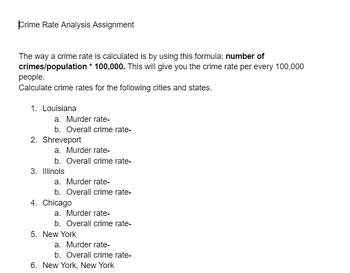
Crime Rate Analysis Assignment
A web based assignment to allow students to calculate the crime rates of various U.S. cities.
Grades:
5th - 12th, Higher Education, Adult Education
Types:
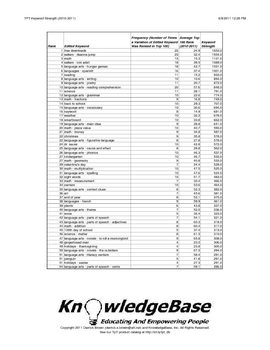
TPT KeyWord Strength Index (2010-2011) - Downloadable PDF!
What are the strongest keywords on TpT?
1. free downloads
2. Deanna Jump
3. math
Neither #1 nor #2 are surprises, but #3 (math) was certainly a surprise to me!
This report analyzes TpT's 2010-2011 keywords using a measure called "keyword strength".
The measure is based on a keyword's average rank, as well as the number of times it appeared in the 2010-2011 "Top 100" TpT search engine rankings.
This can be a valuable tool to help sellers understand TpT's marketplace supply and demand!
The P
Subjects:
Grades:
PreK - 12th, Higher Education, Adult Education, Staff

STD Computer Lab
Students learn about myths and facts of STDs, how they are prevented and the symptoms of Chlamydia, Gonorrhea, Genital Herpes, HPV, Syphilis, Trichomoniasis and Genital warts using a computer and the National Institute of Health websites. There is also a math and English Language Arts (ELA) component as well.Please give feedback, review on TPT and email me with any ask questions: williamshandsonscience@gmail.comThanks so much!!!Geologic Time Scale Card SortGenetic Variation Lab and ActivitiesSTD
Subjects:
Grades:
6th - 10th

Misleading Graph WebQuest
This editable Google Doc contains 10 questions and is to be used with the following website:5 Ways Writers Use Misleading Graphs To Manipulate YouI also recommend starting the lesson by showing the following YouTube videos:How to spot a misleading graphHow statistics can be misleading
Subjects:
Grades:
6th - 12th
CCSS:
Data and Information WebQuest and Media Piece Project
Data and Information WebQuest and Media Piece ProjectDescription:Dive into the fascinating world of data and information with our engaging Data and Information WebQuest and Media Piece Project! Designed for students in grades 6-10, this resource takes learners on a journey to explore data representation, storage and retrieval, and the basics of databases. After completing the WebQuest, students will showcase their understanding by creating a media piece (PowerPoint presentation, Google Slides, i
Grades:
6th - 12th
Types:
Also included in: The Cybersecurity and Computer Science Master Collection for Grades 6-12
Analyzing Misleading Graphs
Students are to find a graph online. They are given a url and other resources on how to find it. From there, they are to write a paragraph analyzing the validity of the graph. They are to include the title, resource, what the article is trying to convey, how it is/is not misleading, and at least two suggestions on how to make the graph more clear. Since this is a web-based assignment, it would be perfect for distance learning. Included:Student directions (in word doc so editable for your classro
Subjects:
Grades:
7th - 12th
Types:
CCSS:

Probability WebQuest
A webquest is a computer based task that requires students to complete an online scavenger hunt. They click on links that lead to tutorials and discover formulas about how to find the probability of a single or compound events.
Subjects:
Grades:
6th - 9th
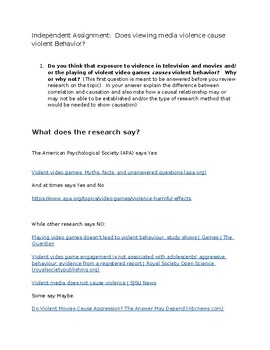
Does viewing media violence cause violent behavior? What does the research say?
This product asks students to weigh in on the possible causal connection between exposure to violent media and violent behavior. Students are asked to state their thoughts both prior to and after reviewing the existing literature on the topic. Research articles present arguments both affirming and denying the causal connection. Multiple meta-analysis article links are also provided. Students are asked to note if their stance on the issue changed after viewing the research and to explain why
Subjects:
Grades:
9th - 12th, Higher Education, Adult Education
Types:
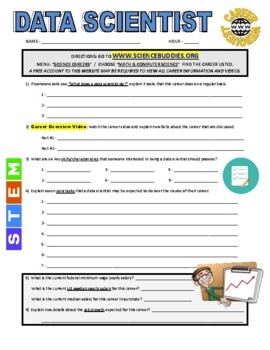
Science and Math Career Webquest - Data Scientist (STEM / Computers / Sub Plans)
CAREER WEBQUEST : DATA SCIENTISTSUBJECTS: SCIENCE, CAREERS, MATH, STEM, COMPUTERSGRADES : 8-12DISTANCE LEARNING: YES!SUB PLANS: YES!This internet assignment is designed to be used with www.sciencebuddies.org. Full directions for students to link to the correct page career are provided with the webquest.Important Website Information: Please be aware that a FREE account with sciencebuddies.org will be required in order for students to view all videos and information connected with this career webq
Subjects:
Grades:
8th - 12th
Types:
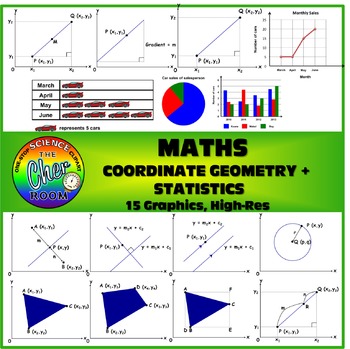
MATH Clipart: Coordinate Geometry and Statistics
15 Graphics on Coordinate Geometry and Statistics
You'll find diagrams that illustrates the following:
Gradient
Mid Point
Point at a ratio
Area of geometry
pi chart
pictogram
bar chart
line graph
This product is allowed for both personal and commercial use, but credit must be given to my store: https://www.teacherspayteachers.com/Store/The-Cher-Room
Subjects:
Grades:
7th - 12th
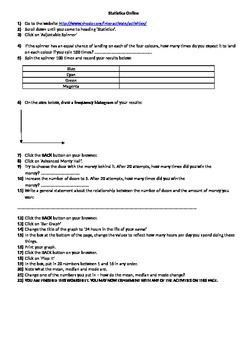
Statistics Webquest / Internet Interactive Activities
This worksheet provides students with a number of websites that feature interactive statistics activities. Students are required to complete activities and answer questions based upon these websites.
Subjects:
Grades:
5th - 10th
Types:
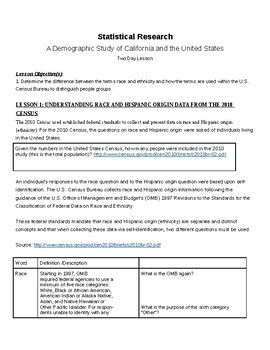
SAT Prep: Charts, Tables, and Graphs using U.S. Census Data Study
This lesson uses data from the 2010 U.S. Census to allow students to access numbers and data in a social science classroom. The lesson is a 2 day mini-unit centered on working with charts, graphs, and tables (serves extremely well for SAT and ACT prep). This cross-curricular lesson draws meaningful parallels between math and social science, and the necessity of bringing these subjects together. The lesson uses a comparative look at Census data for California and the United States as a whole, but
Subjects:
Grades:
9th - 12th
Types:
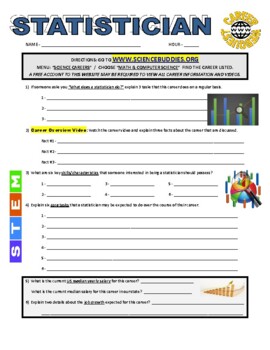
Science Career Webquest - Statistician (Math / STEM / distance learning / sub)
CAREER WEBQUEST: STATISTICIANGRADES : 8-12DISTANCE LEARNING: YES!SUB PLANS: YES!This internet assignment is designed to be used with www.sciencebuddies.org. Full directions for students to link to the correct page career are provided with the webquest.Important: Please be aware that a FREE account with the website may be required in order for students to view all videos and information connected with this career. Teachers should review the website in advance to gauge ease of use and accessibilit
Grades:
8th - 12th
Types:
Also included in: STEM CAREER WEBQUEST BUNDLE - (Distance Learning / Science / Math / Sub)
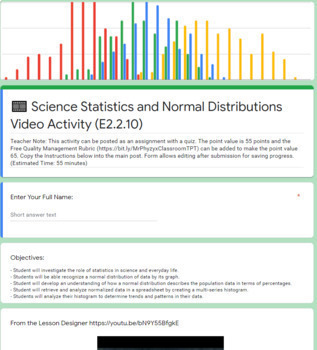
Science Statistics & Normal Data LinkLesson® - Online Blended Distance Learning
Description: Students learn about how statistics have become an important part of analyzing scientific data including normal distributions, graphing, spreadsheets while analyzing historical data on human height. After viewing instructional media and answering formative questions, they will retrieve scientific data, import it into a spreadsheet, and superimpose four sets of normally distributed data graphs, before completing a short reflective writing. (60-90 min, 26 Pages if printed)See an overv
Subjects:
Grades:
8th - 12th, Higher Education, Adult Education
Types:
Primary and Secondary Data
This lesson is the lesson after "Samples and Populations". This lesson has the content included and will allow students to engage in a research project as they discover the different methods included in Samples and Populations. This lesson supports the textbook "Maths Quest 8".
The resources that you will also need for this lesson is butchers paper and marker pens.
Subjects:
Grades:
7th - 9th
Dice Bulletin Board Letters
These dice themed alphabet letter will brighten up your bulletin board display. All 26 alphabet letters are included in an uppercase font, as well as numerals 0-9 and punctuation. Letters are approximately 6 inches tall. Just print what you need and enjoy. Be sure to check out my other fun, themed letters in my store.
Subjects:
Grades:
PreK - 12th, Higher Education, Adult Education, Staff
Statistics Vocabulary TEKS Aligned
This product includes several vocabulary words for a statistics unit. There are three graphs that will be able to cut and match, along with definitions of vocabulary words.
This is aligned with the Texas TEKS
6.12B 6.12C 6.12D 6.13B
I hope this can be useful to you and your students!
Stop by my store for some free fonts!
S&S Designs
https//www.teacherspayteachers.com/Store/S-And-S-Designs
Subjects:
Grades:
6th - 9th
Statistics / AP Statistics Word Cloud Bulletin Board
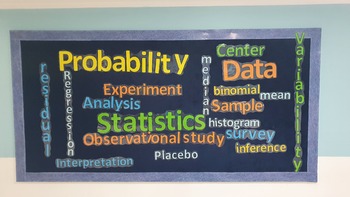
The product is a word cloud for Statistics / AP Statistics.It is a PDF documents of the letters of different sizes forming the words shown in the bulletin board. ( few more words are in the document but not on the board). The colored used in the document are 5 named as color 1, color 2 .... at the bottom of the page. You can choose your own colors.For time saving, use a cricut or similar device if available.Best of luck!
Subjects:
Grades:
11th - 12th, Higher Education, Adult Education

MedAware Labels and Chart Kit Booklet
Always Know When, What, Why and How Medications are taken.
(Avoid under and overdosing prescription, generic and other drugs).
Subjects:
Grades:
PreK - 12th, Higher Education, Adult Education, Staff
t-statistic "Find Your Match" Activity
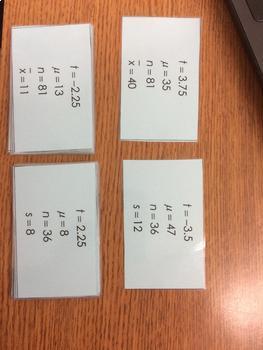
PLEASE RATE! :) My Statistics students needed practice when they first learned how to calculate a t-statistic. I came up with this activity that requires students to work backwards using the t-statistic formula to either find the sample mean or the sample standard deviation.
Each student will have different numbers, but two of the cards will have the same sample mean and same sample standard deviation. Once the student solves for the missing statistic, they will walk around and find anothe
Subjects:
Grades:
11th - 12th
Showing 1-24 of 35 results


