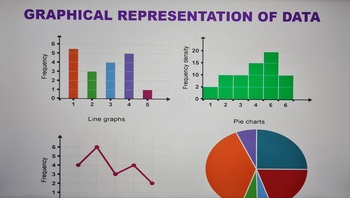
Graphical Representation of Data Powerpoint
- Zip
Products in this Bundle (5)
Also included in
- The presentation contains: 1) TALLY MARKS Learning Objectives. Definition of a tally mark. Uses of tally mark. How to count a tally mark. Tally Mark Chart. Construction of a tally mark table with an example. Application on real life problems on tally mark. Read and Interpret a tally mark table.ThePrice $48.00Original Price $48.00
Description
The presentation contains the follows:
1) BAR GRAPH
Learning objectives.
Definition of a bar graph.
Parts of a bar graph.
Tips for construction of bar graph.
Steps to construct bar graph with an example.
Types of bar graph.
Advantages of bar graph.
2) DOUBLE BAR GRAPH
Learning Objectives.
Definition of a double bar graph.
Parts of a double bar graph.
Difference between bar graph and double bar graph.
Tips for construction of double bar graph.
Steps to construct double bar graph with an example.
To read and interpret the double bar graph.
3) LINE GRAPH
Learning objectives.
Definition of a line graph.
Parts of a line graph.
Tips for construction of line graph.
Steps to construct line graph with an example.
Reading and Interpreting a line graph.
Advantage of line graph.
4) PIE CHART Learning Objectives.
Definition of a Pie Chart.
Tips for construction of pie chart.
Steps to construct a pie chart with an example.
Scaling and drawing a pie chart.
Read and Interpret a pie chart.
5) HISTOGRAM Learning Objectives.
Definition of a Histogram.
Parts of a histogram.
Difference Between bar graph and histogram.
Types of intervals.
Tips for construction of bar graph.
Steps to construct bar graph with an example.
Read and Interpret a histogram.


