143 results
7th grade graphing rubric activboard activities
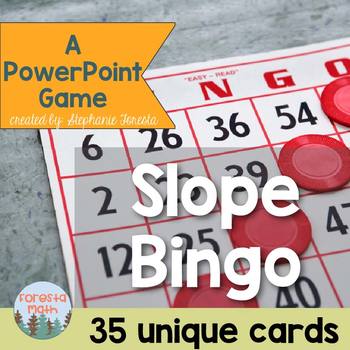
Slope Bingo
This PowerPoint game provides students with practice for finding the slope m of the graph of a linear function. There are 35 unique bingo cards in PDF form, each with 25 different graphs of linear functions. Students write the slope of each line on their bingo card in the space under each graph before the Power Point Game begins. When Power Point is enabled and in slide show view bingo balls bounce around on the screen, simulating real balls in a bingo machine. Student select a bingo ball eith
Subjects:
Grades:
7th - 10th
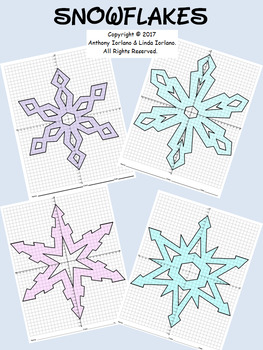
Snowflake Bundle Mystery Pictures (4-Quadrants)
Snowflake Mystery Picture Bundle containing 4 drawings 4-Quadrants Fractional points (1/2 – one drawing with four 1/4 points) These coordinate graphing projects are fun for the student and makes a great bulletin board idea as well. Students will use their knowledge of coordinate graphing and ordered pairs to create drawings of Snowflakes. This will be created by plotting ordered pairs and then connecting them with straight lines.This activity can be a class project or something to be worke
Grades:
6th - 8th
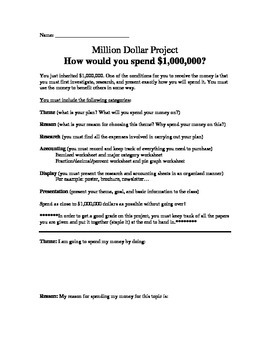
Million Dollar Project (Graphing, decimals, fractions, accounting and percents)
What would you do with a million dollars? How would you spend it?
In this project you've been left a 1 million dollar inheritance. The catch is you must first research and present how you will spend the money.
In the first part of the experiment, the students will fill out an accounting chart, where they will fill out an itemized chart displaying each item they plan on purchasing to complete their million dollar project. They will than be asked to put all those items into major categorie
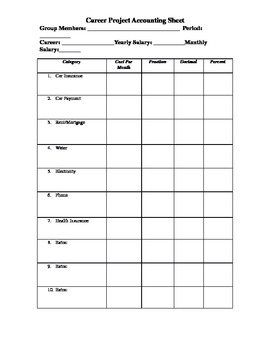
Career Monthly Bils Circle Graph Project
In this project students draw a career and select 10 of their monthly bills. They then figure what percent of their monthly salary goes to each item and create a circle graph showing where their money goes. The file you will receive includes a rubric for the project, an accountability sheet, 24 "career cards", a list of choices for the 7 required and 3 choice items in the project, and teachers notes about how the project has been made successful in their class. It is a word document so any of th
Subjects:
Grades:
6th - 8th
Types:
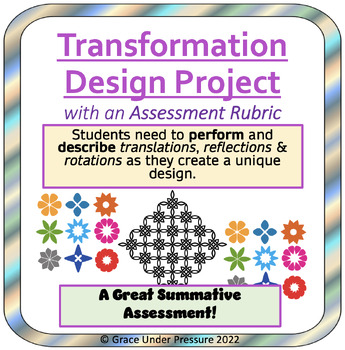
Transformation Geometry Project with an Assessment Rubric: Gr 6-8 Geometry
This creative and fun math geometry project assesses students’ ability to perform and describe 3 kinds of transformations: translations, rotations, and reflections. It is a great summative assessment for your transformation unit!It will take several work periods for students to create their design and write or type a detailed explanation of the process. This is how I can really see if they understand the concepts. I encourage students to describe their process using specific mathematical vocabul
Subjects:
Grades:
6th - 8th
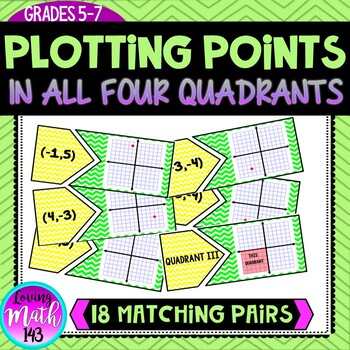
Plotting Points on the Coordinate Plane Matching Activity (All Four Quadrants)
This middle school math matching activity is a great way for students to practice identifying ordered pairs in all four quadrants. Students will match the ordered pair to the graph. Students will also identify all four quadrants. This matching center works great in small groups and/or math centers. Students will match 18 pairs! This matching center comes in black and white and color!This activity works great in small groups or partners. It is also a great resource as a scaffold for English Lang
Grades:
6th - 8th
Also included in: Graph and Reflect on the Coordinate Plane {BUNDLE!}

Relations PowerPoint Lesson - Introduction to Functions
This 14-page PowerPoint Lesson introduces students to the concepts of relations and examines them as sets of ordered pairs, as tables, and as graphs. The concept of domain and range are also introduced. The presentation contains multiple "Your Turn" activities to check for student understanding prior to moving on,This PowerPoint lesson could be used as a pre-activity for functions, Common Core 8.F.A.1. I have found that introducing relations before functions really eliminates a lot of confusi
Grades:
7th - 8th
Also included in: Middle School Math PowerPoint Bundle - Distance Learning
Ice Cream Inequalities- An inequality review game
This is a fun game for your students to use as they review inequalities and their graphs. You can use it with your entire class or with a small group.
Clicking on the ice cream point values takes you to the question. Then click on the ice cream parts to make them disappear.
Enjoy!!
Subjects:
Grades:
6th - 8th
Types:
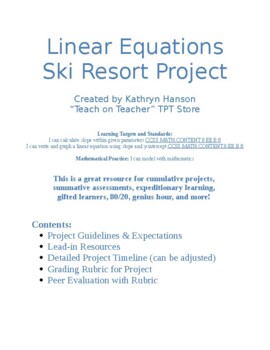
Linear Equations Ski Resort Project w/ Timeline, Rubrics, & Peer Evaluation
Get ready to see students amaze you with their high-quality work as they demonstrate their learning of linear equations and functions. Students will design and create a model of a ski resort, using y = mx + b to construct 2-D and 3-D ski slopes! This project is great for general education classrooms, differentiated groupings, gifted learners, expeditionary learning, cumulative and summative assessments, genius hour, 80/20, passion projects, and so much more! What's best is it reaches all learnin
Grades:
7th - 10th
Types:
CCSS:

Collecting, Organizing and Interpreting Data Assignment -Data Management Digital
In this culminating task, students will create a survey question, organize their data using frequency tables, graph their data and interpret their results. They will also find the mean, median, mode and range of the data.This is assignment asks students to create a presentation that will include the following:A survey questionMean, Median, Mode and Range of the dataFrequency table for the data3 different visual representations of their findingsInterpretation of the resultsThis product includes
Grades:
4th - 8th
Types:
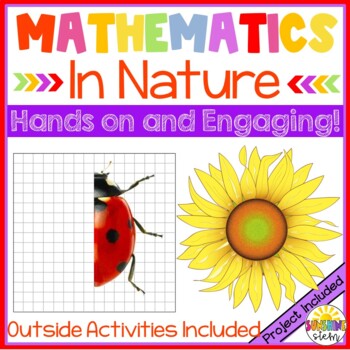
Mathematics in Nature {CCSS Math and NGSS Aligned}
Students explore and apply the principles of mathematical patterns in nature in a fun and engaging way! First, students identify and describe patterns in the natural world before heading outside to find patterns on their own. Next, students begin to explore number patterns in nature using the Fibonacci sequence. Fin fingerprint activity keeps students interested and engaged! Next, explore cycles in nature by creating a model on paper using 3-dimensional objects. Rubric included. Students are
Grades:
4th - 7th
Types:

Functions PowerPoint Lesson - Distance Learning
This 21-page editable PowerPoint lesson covers relations vs. functions, defining and identifying functions, dependent vs. independent variables, creating function tables given the linear equation, and writing a function rule. Student "Your Turn" slides allow students to work individually or in small groups to master each concept before moving on. Interactive Notes are available for this lesson - see link below.I do not “lock” my PowerPoint lessons. We all have to differentiate and teach to th
Grades:
6th - 9th
Also included in: Middle School Math PowerPoint Bundle - Distance Learning
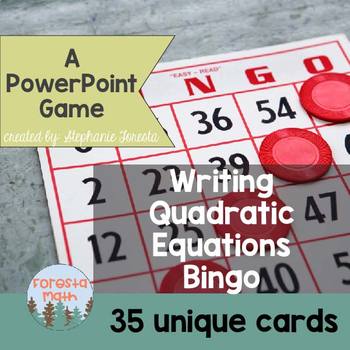
Writing Quadratic Equations Bingo
This PowerPoint game provides students with practice for finding the equation of a graph of a quadratic function. There are 35 unique bingo cards in PDF form, each with 25 different graphs of quadratic functions. Students write the equation of each graph on their bingo card in the space under each graph before the Power Point Game begins. When Power Point is enabled and in slide show view bingo balls bounce around on the screen, simulating real balls in a bingo machine. Student select a bingo
Subjects:
Grades:
7th - 10th
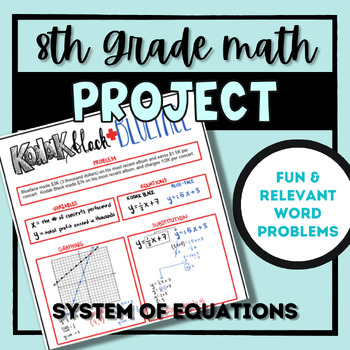
System Of Equations Project (With Relevant Student Problems)
This project incorporates relevant-to-student word situations and has students create, solve, and describe the equations, graphs, and tables of the two equations, as well as the solution to the system. It includes student handouts, an answer key, and rubrics for students, as well as a student-exemplar for them to refer to. It also includes an editable link to quickly change the names and make it more relevant to your students!
Transformations Project - Translations, Rotations, Reflections, and Dilations
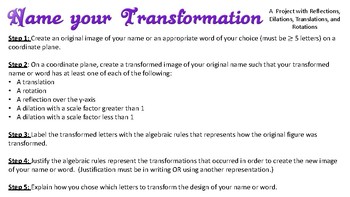
This short project called "Name your Transformation" is designed to give students the opportunity to create a graphical image of their name or word of their choice and then transform it in a way that creates a fun design of their name or word. Steps and criteria are provided for students to transform the figures or letters of their name/word and justify their work. Graph paper is provided for their original image but students are encourage to complete their transformed image on a larger grid pap
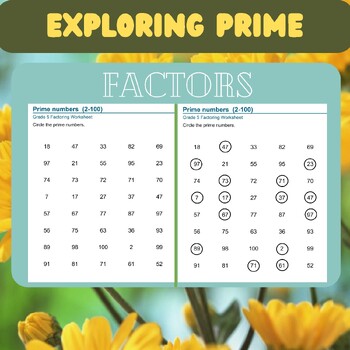
Exploring Prime Factors: Grade 5 Math Worksheets
These grade 5 math worksheets offer comprehensive practice in factoring numbers and determining prime factors, reinforcing students' understanding of divisibility rules and prime numbers. With six versions available, students engage in various exercises designed to enhance their proficiency in identifying prime factors and utilizing factor trees.Factoring Numbers between 4 and 100: Students practice factoring numbers between 4 and 100, identifying factors that divide into each number evenly with
Subjects:
Grades:
5th - 7th
Which Graph Do I Use to Display Data? Flip Chart
This review of various graphs indicates which graph is best to use for certain types of data. At the end, there is a 10 question multiple choice activote activity where the students are given a situation and have to choose the correct graph to display their data.
Subjects:
Grades:
4th - 8th
Types:
SLOPE INTERCEPT BINGO
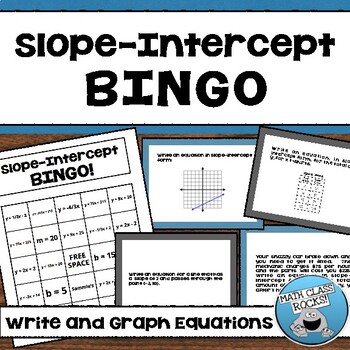
Engage ALL of your students, practice writing equations in slope-intercept form, and have a GREAT day playing BINGO in math class! This activity is a perfect way to practice a skill or review before a test and the kids REALLY love it!Mathematical Concepts Included in This Activity:Identify the slope on a graph and in a table of values.Identify the y-intercept on a graph and in a table of values.Write an equation from a graph.Write an equation from a table.Write an equation for a word problem.Wri
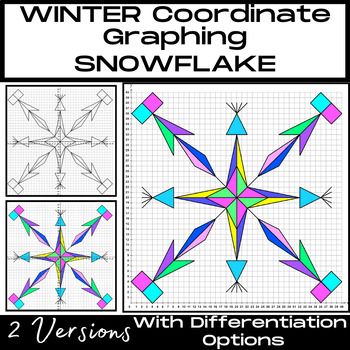
Coordinate Graphing Symmetrical Design-2 Versions-Ordered Pairs
See this resource BUNDLED with 3 other snowflakes/symmetrical designsDescriptionWith this resource, students practice plotting coordinate points (ordered pairs) in the first quadrant and in all four quadrants to produce these fun winter snowflakes.This resource has two versions.Version A requires plotting points in the first quadrant using positive whole numbers only, e.g., (2, 5), (10, 1), etc.Version B requires plotting points in all four quadrants using positive and negative whole numbers, e.
Grades:
5th - 9th
Also included in: BUNDLE-SNOWFLAKE/SYMMETRICAL Designs-Coordinate Graphing-Bulletin Board
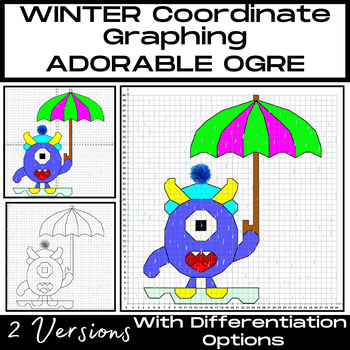
WINTER NEW YEAR Coordinate Graphing Monster Picture - ADORABLE OGRE in the Rain
DescriptionWith this resource, students practice plotting coordinate points (ordered pairs) to produce an Adorable Ogre in the rain. This resource has two versions:Version A requires plotting points in the first quadrant using positive whole numbers only and one point containing a decimal is used (e.g., 20.5, 8). This point is used four times in each instruction sheet.Version B requires plotting points in all four quadrants using positive and negative whole numbers, and one point containing a de
Subjects:
Grades:
5th - 9th
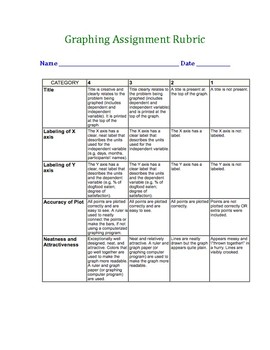
Graphing Rubric for Student Graphs
see preview.....check preview!100 WORD SEARCHES HERE!!!!!THIS RESPONSE JOURNAL MIGHT BE HELPFUL, TOO!POSTERS FOR YOUR CLASSROOM!GREAT RUBRIC BUNDLE!MY BEST PRODUCT-BUSINESS CLASS!GOOD CHARACTER WORD SEARCH!GROUP WORK SELF-EVALUATION!SOCIAL STUDIES BUNDLE…Lots of presentation rubrics!
Subjects:
Grades:
7th - 12th
Types:

Introduction to Sharks, Skates and Rays
Biology, Marine Biology, Upper Level Elementary ScienceIncluded in the package:- Introduction to Sharks Powerpoint (41 slides)- Shark Anatomy Powerpoint (46 slides)- Cartilaginous Fish (Rays & Skates) (44 slides)- Shark Game Show (Jeopardy style) Review PowerpointTo assess:- Shark Test- Shark Test Study Guide- Shark Test Study Guide ANSWERS- Cartilaginous Fish Quiz - Cartilaginous Fish Quiz ANSWERSStudents Research and Activities:- Shark Species Internet Research Questions- Shark Species Pre
Recognize Proportional Relationships
Common Core Standard 7.RP.2.a
Decide whether two quantities are in a proportional relationship, e.g., by testing for equivalent ratios in a table or graphing on a coordinate plane and observing whether the graph is a straight line through the origin.
Use the following Smart Board pages as a center, as an alternate teaching format for small groups or 1:1, or as formative or summative assessment.
You can also print and laminate the pages to use with dry erase markers for discrete t
Subjects:
Grades:
6th - 8th
CCSS:
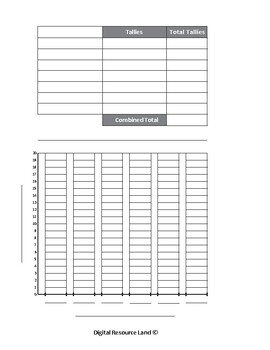
Tally and Graphing Bundle - Bar Graph - Blank and Subjects
Tally and Bar Graphing WorksheetsBlankFavourite SportFavourite SubjectFavourite FoodFavourite Pet6 Sections for Items and Bar Graphing. 1-20 Increments.Fill in Titles and x/y SubtitlesGreat for iPad (Showbie), IWB and Worksheets.
Subjects:
Grades:
2nd - 8th
Showing 1-24 of 143 results


