TPT
Total:
$0.00

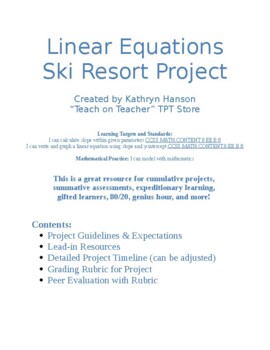
Linear Equations Ski Resort Project w/ Timeline, Rubrics, & Peer Evaluation

Rated 5 out of 5, based on 2 reviews
5.0 (2 ratings)
;
Teach-On Teacher
39 Followers
Grade Levels
7th - 10th
Resource Type
Standards
Formats Included
  • Word Document File
Pages
10 pages
$8.00
$8.00
Share this resource
Report this resource to TPT
Teach-On Teacher
39 Followers

What educators are saying

This project has been a blast. The students have worked in groups and presented to local business owners.

Description

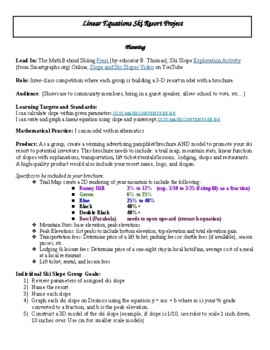
Get ready to see students amaze you with their high-quality work as they demonstrate their learning of linear equations and functions. Students will design and create a model of a ski resort, using y = mx + b to construct 2-D and 3-D ski slopes!

This project is great for general education classrooms, differentiated groupings, gifted learners, expeditionary learning, cumulative and summative assessments, genius hour, 80/20, passion projects, and so much more! What's best is it reaches all learning styles!

This activity applies linear equations y = mx + b and modeling linear functions.

Grade Levels 7-10 (standards can be adjusted on assignment based on rigor and differentiation)

Packet includes:

· Project Guidelines & Expectations with Common Core Standards and Learning
Targets

· Lead-in Activity Resources

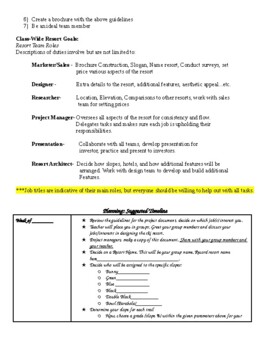
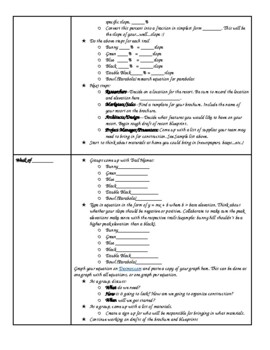
· Detailed Project Timeline

· Grading Rubric for Project (4-3-2-1 can be adjusted to percents or letter grades.)

· Peer Evaluation with Rubric (one of my popular resources that can be edited for any
group project!)

If you would like to message me for pictures of my finished projects past, and present...feel free! You will love the end products, and again, be amazed at what your students can do when given the freedom to create and take risks!

Project time varies... timeline can be shortened or lengthened depending on the class, and if it's used for 80/20 or genius hour.

Thanks for viewing!

Total Pages
10 pages
Answer Key
N/A
Teaching Duration
N/A
Report this resource to TPT
Reported resources will be reviewed by our team. Report this resource to let us know if this resource violates TPT’s content guidelines.

Standards

to see state-specific standards (only available in the US).
Use similar triangles to explain why the slope m is the same between any two distinct points on a non-vertical line in the coordinate plane; derive the equation 𝘺 = 𝘮𝘹 for a line through the origin and the equation 𝘺 = 𝘮𝘹 + 𝘣 for a line intercepting the vertical axis at 𝘣.
Interpret the equation 𝘺 = 𝘮𝘹 + 𝘣 as defining a linear function, whose graph is a straight line; give examples of functions that are not linear. For example, the function 𝘈 = 𝑠² giving the area of a square as a function of its side length is not linear because its graph contains the points (1,1), (2,4) and (3,9), which are not on a straight line.
Construct a function to model a linear relationship between two quantities. Determine the rate of change and initial value of the function from a description of a relationship or from two (𝘹, 𝘺) values, including reading these from a table or from a graph. Interpret the rate of change and initial value of a linear function in terms of the situation it models, and in terms of its graph or a table of values.
Distinguish between situations that can be modeled with linear functions and with exponential functions.
Interpret the parameters in a linear or exponential function in terms of a context.

Reviews

Questions & Answers

39 Followers