166 results
Statistics outlines under $5
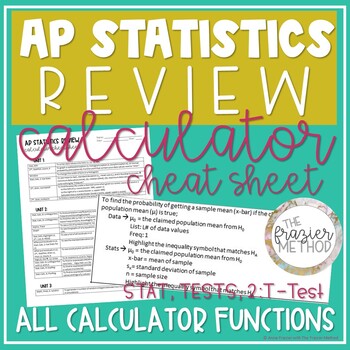
AP Statistics Review - Calculator Cheat Sheet for TI-84 Plus CE on AP Stats Exam
AN ENTIRE YEAR OF STATISTICS CALCULATOR FUNCTIONS for the TI-84 PLUS CE or TI-84 PLUS!!! Is AP Statistics hard? Not with this all-in-one AP Statistics calculator cheat sheet! Use this AP Statistics worksheet of calculator functions to help your students review for the AP Stats Exam! This AP Statistics reference sheet includes calculator functions from Units 1-7 - such as linear regression, probability formulas, graphs, re-expression, confidence intervals hypothesis tests, and more! This is a one
Subjects:
Grades:
9th - 12th, Higher Education
Types:
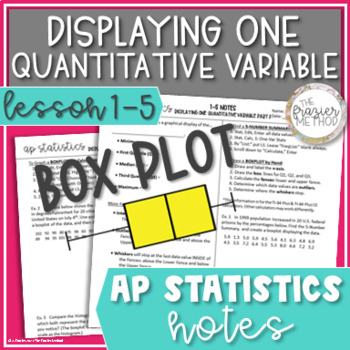
AP Statistics Notes Box Plot / Boxplot, Quartile, IQR, Outlier, 5 Number Summary
AP Stats notes to teach or review BOXPLOTS / BOX PLOTS / BOX-AND-WHISKER PLOTS! Define & calculate the median, interquartile range, 5-Number Summary, minimum, maximum, first quartile (Q1), third quartile (Q3), and percentiles for a set of data. Also, determine which data values are outliers based on the upper fence and lower fence of a boxplot. Students will graph box plots by hand given just a few of the data values and with step-by-step TI-84 Plus CE Calculator directions given the full li
Subjects:
Grades:
9th - 12th
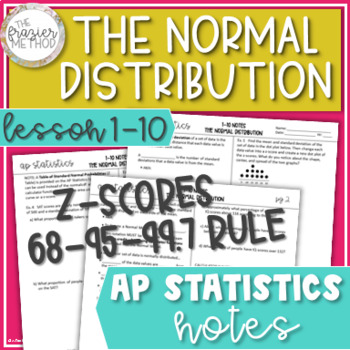
AP Statistics Notes Normal Distribution Z-Scores Empirical Rule Normal Model
Great AP Stats notes on the NORMAL DISTRIBUTION & Z-SCORES! Students will use the Normal Model and Empirical Rule (68-95-99.7% Rule) to find a data value, calculate z-scores, and find the area under the Normal curve using both the z-score formula and TI-84 Plus CE calculator functions. Students will also interpret z-scores in context, write the Normal Model notation N(µ, σ), and determine whether a data value can be considered “unusual.” Perfect for AP Stats Exam review prep! Aligns with AP
Subjects:
Grades:
9th - 12th
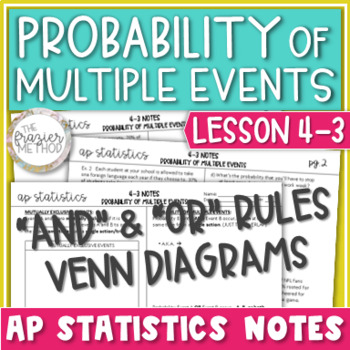
AP Statistics Notes Compound Probability of Multiple Events & Mutually Exclusive
AP Statistics notes on COMPOUND PROBABILITY OF MULTIPLE EVENTS / AND & OR PROBABILITY RULES with VENN DIAGRAMS and Mutually Exclusive Events! Students will define and calculate the probability of Events A AND B, the probability of Events A OR B, and the probability of an event’s complement. Students will also determine whether events are MUTUALLY EXCLUSIVE. Use these notes pages as AP Stats Exam review prep! Aligns with AP College Board's objectives and standards for AP Statistics Unit 4: Pr
Subjects:
Grades:
10th - 12th
Also included in: AP Statistics Notes Unit 4 Bundle - Probability Rules & Random Variables
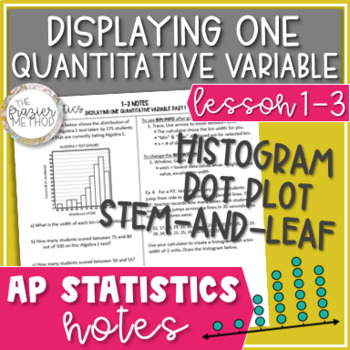
AP Statistics Notes Histograms, Dot Plots, & Stem-and-Leaf Plots - Data Displays
AP Stats notes to teach or review graphing and reading DOT PLOTS, STEM-AND-LEAF PLOTS, & HISTOGRAMS! Students will graph histograms using a TI-84 Plus CE Calculator and graph a dot plot and stem-and-leaf plot by hand. Practice problems and examples include answering questions about a set of data values displayed in a histogram. Great for AP Stats Exam prep! Aligns with AP College Board's updated 2019-2020 objectives and standards for AP Statistics Unit 1: Exploring One-Variable Data. WHAT’S
Subjects:
Grades:
9th - 12th
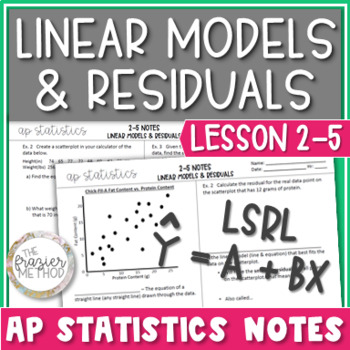
Linear Models & Residuals / Regression Line of Best Fit - AP Statistics Notes
AP Stats Notes on LINEAR MODELS & RESIDUALS. Write the equation of a linear regression model from a list of data values and use step-by-step TI-84 Plus CE Calculator directions to find the equation of the Line of Best Fit / Least Squares Regression Line (LSRL). With formulas and the regression equation, calculate residuals (e), predicated values (y-hat), y-intercept, & slope of the linear model. Templates for “interpret in context” questions are also included! Great AP Stats Exam prep! A
Subjects:
Grades:
10th - 12th
AP Statistics Notes - UNIT 5 BUNDLE - Sampling Distributions Proportions & Means
These AP Statistics notes will help you teach or review SAMPLING DISTRIBUTIONS FOR SAMPLE PROPORTIONS & SAMPLE MEANS! You can also use these notes pages to help your students review for the AP Statistics Exam! Aligns with AP College Board's objectives and standards for AP Statistics Unit 5: Sampling Distributions. WHAT’S INCLUDED IN THIS PRODUCT?5-1 Sampling Distributions of Sample Proportions2 Pages, Blank Pages & Answer KeyIntroduces sampling distributions and sampling distributions of
Subjects:
Grades:
10th - 12th
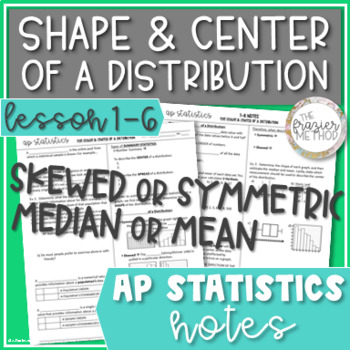
AP Statistics Notes Shape & Center of Distribution, Median Mean, Skew Symmetric
Here's AP Stats notes on SHAPE & CENTER OF A DISTRIBUTION – SYMMETRIC OR SKEWED, MEDIAN & MEAN! Calculate the median and mean from a list of data values and estimate the median and mean from a histogram, boxplot, stem-and-leaf plot, dot plot, and cumulative relative frequency plot. Determine which measure of center to use based on the shape of the distribution – skewed or symmetric. Other terms defined in these notes include sample, population, statistics with symbols, parameters with sy
Subjects:
Grades:
9th - 12th
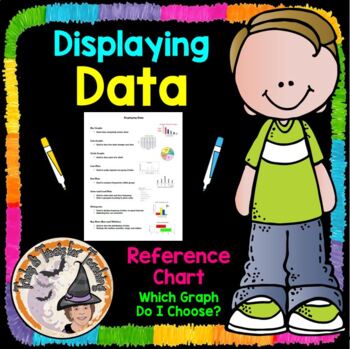
Displaying Data Reference Chart Notes Which Graph Do I Choose?
Math Teachers ~ You'll LOVE this Displaying-Data, Which-Graph-Do-I-Choose? Data-Display Reference-Chart will be SUPER helpful to your students in helping them determine which graph to choose, and provides a quick visual picture to remind them what that particular graph looks like. I printed one of these for each of my students to put inside their Math Toolkit Notebook, to use as a Reference for Data Displays Charts and Graphs. You'll enjoy using this year after year!Be sure to L@@K at my other 1
Subjects:
Grades:
5th - 8th
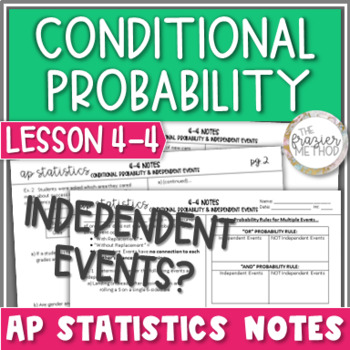
AP Statistics Notes Conditional Probability Venn Diagrams & Independent Events
AP Statistics notes on CONDITIONAL PROBABILITY & INDEPENDENT EVENTS! Define and identify independent events, prove independence using P(B) = P(B|A), and calculate conditional probability from two-way tables. Aligns with AP College Board's objectives and standards for AP Statistics Unit 4: Probabilities, Random Variables, & Probability Models. WHAT’S INCLUDED IN THIS PRODUCT?Lesson 4-4: Probability Rules Part 3 – Conditional Probability & Independent EventsNOTES – 3 Pages, Blank Pages
Subjects:
Grades:
10th - 12th
Also included in: AP Statistics Notes Unit 4 Bundle - Probability Rules & Random Variables
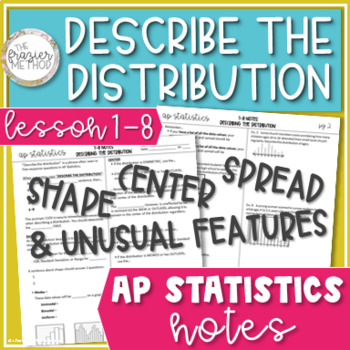
AP Statistics Notes Describe the Distribution Shape, Center, Spread, Outliers
AP Stats notes on DESCRIBE THE DISTRIBUTION! Describe the shape as skewed or symmetric, center with median or mean, spread with standard deviation or interquartile range, and unusual features of histogram, box plot, stem-and-leaf plot, dot plot, & cumulative relative frequency plot. Also determine which measure of center (median or mean) and measure of spread (range, standard deviation, or interquartile range) to use based on the shape of the distribution (skewed or symmetric). Other terms d
Subjects:
Grades:
9th - 12th
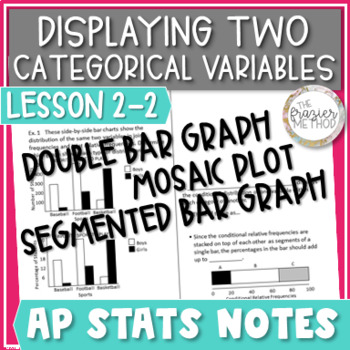
Segmented Bar Graph, Side-by-Side Bar Graph, & Mosaic Plot - AP Statistics Notes
AP Stats Notes on graphing two categorical variables in a SEGMENTED BAR GRAPH, SIDE-BY-SIDE BAR GRAPH, & MOSAIC PLOT! Identify which graph(s) can display joint frequencies, joint relative frequencies, and/or conditional relative frequencies (conditional distribution). Define and distinguish between independent and associated variables. Great for AP Stats Exam review prep! Aligns with AP College Board's updated 2019-2020 objectives and standards for AP Statistics Unit 2: Exploring Two-Variabl
Subjects:
Grades:
9th - 12th
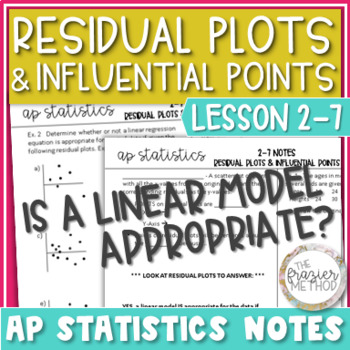
Residual Plots, Influential Points, & Extrapolation - AP Statistics Notes
AP Stats Notes to teach or review linear regression’s RESIDUAL PLOTS, INFLUENTIAL POINTS, & EXTRAPOLATION. Includes step-by-step instructions for TI-84 Plus CE Calculators to create a list of residuals and graph the residual plot. Use a residual plot to answer the question “Is the linear model appropriate for the data?”, determine if a point on a scatterplot / scatter plot is influential, and recognize when extrapolation occurs. Aligns with AP College Board's updated 2019-2020 objectives and
Subjects:
Grades:
10th - 12th
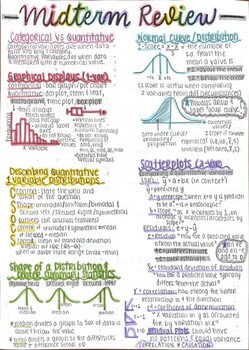
AP Statistics Midterm Review Study Guide
Handwritten Review for AP Statistics Midterm (Semester 1) ContentThis review sheet includes Unit 1 - 4 which covers:Univariate DataCategorical & Quantitative Summary StatisticsBivariate Data (Scatterplots & Two Way Tables)Sampling & Experimental DesignProbability & Random Variables
Subjects:
Grades:
10th - 12th
Types:
AP Statistics Notes WITH VIDEO - Types of Bias / Sources of Bias
These AP Statistics NOTES WITH VIDEO will help you teach the TYPES OF BIAS – undercoverage bias, nonresponse bias, voluntary response bias, response bias, question-wording bias, and self-reporting bias! Students will identify the different ways each type of bias may present itself, see examples of each type, and examine how non-random sampling methods introduce potential bias. AP Statistics students will also utilize clear instructions for how to answer AP free-response questions involving bias.
Subjects:
Grades:
9th - 12th
Types:
AP Statistics Notes - Type 1 Error, Type 2 Error, & the Power of a Test
With definitions, examples, and practice problems, these AP Statistics notes will help you teach or review ERROR & POWER whether you’re teaching in-person or distance learning! You can also use these notes pages to help your students review for the AP Statistics Exam! Aligns with AP College Board's updated 2019-2020 objectives and standards for AP Statistics Unit 6: Inference for Categorical Data – Proportions. WHAT’S INCLUDED IN THIS PRODUCT?Lesson 6-4: Error & PowerNOTES – 3 Pages, Bla
Subjects:
Grades:
10th - 12th
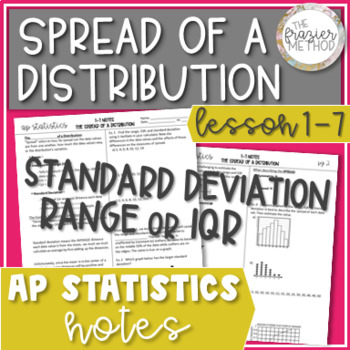
AP Stats Notes Spread of a Distribution, Standard Deviation, Interquartile Range
AP Stats notes on the SPREAD OF A DISTRIBUTION – STANDARD DEVIATION, RANGE, & INTERQUARTILE RANGE! Calculate spread from a list of data values and estimate spread of distributions displayed in a histogram, boxplot, stem-and-leaf plot, dot plot, and cumulative relative frequency plot. Also determine which measure of spread to use based on the shape of the distribution – skewed or symmetric. Use these notes as an AP Stats review for the AP Statistics Exam! Aligns with AP College Board's update
Subjects:
Grades:
9th - 12th
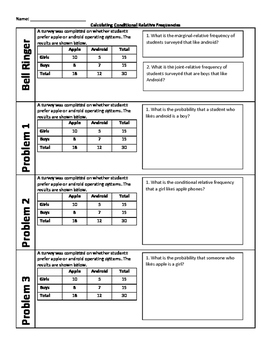
Conditional Relative Frequency (Guided Notes + Stations + Exit Ticket)
This resource contains guided notes on calculating conditional relative frequency for a two-way frequency table that presents interesting information for students. The guided notes are followed by 8 stations with a recording sheet, that asks students questions about conditional frequencies as well as joint and marginal frequencies for review purposes. These stations can be used the same day as the guided notes, or on another day for review. Also included is an exit ticket that focuses on conditi
Subjects:
Grades:
8th - 9th
Types:
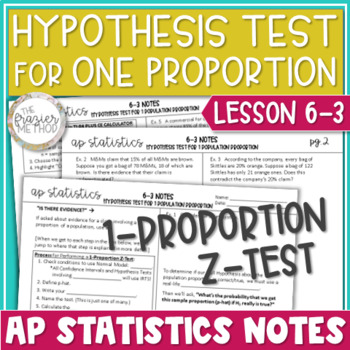
AP Statistics Notes - Hypothesis Test One Proportion Z Test 1-Proportion Z-Test
AP Statistics notes on HYPOTHESIS TESTS FOR ONE PROPORTION / One Proportion Z Test / 1-Proportion Z-Test / 1PropZTest! Includes how to check conditions, write null & alternative hypothesis, calculate p-value, and compare p-value to significance level / alpha level. This lesson teaches Significance Tests for one sample proportion by hand and with TI-84 Plus CE Calculator function. Great AP Stats Exam review prep! Aligns with AP College Board's updated 2019-2020 objectives and standards for AP
Subjects:
Grades:
10th - 12th
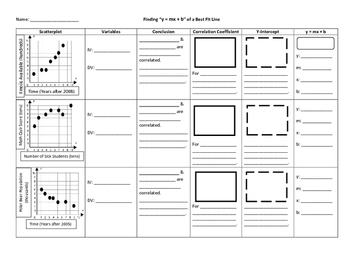
Best Fit Line Equations (Guided Notes/Practice)
These 3 problems are perfect for introducing students to finding the linear equation of a best fit line. The problems ensure students understand the meaning behind the correlation coefficient and the y-intercept. This helps students realize the importance of the linear equation. The extensive problems help review concepts that are important for successfully writing a y = mx + b equation for a best fit line.The answer key provides the exemplar for problem #1. If you want all students getting the
Subjects:
Grades:
8th - 9th
Also included in: Scatterplots Bundle (Weeks of Products!)
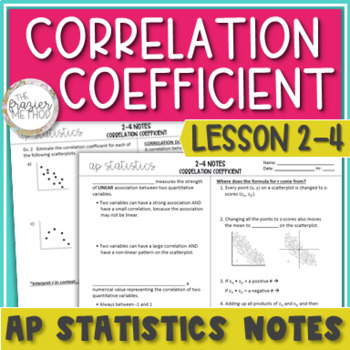
Correlation Coefficient for Scatterplots / Scatter Plots - AP Statistics Notes
Great AP Stats Notes on CORRELATION COEFFICIENT (r)! Includes step-by-step TI-84 Plus CE Calculator directions to calculate correlation coefficient from data values and estimate r using a scatterplot / scatter plot – perfect, strong, moderate, weak, positive, & negative correlation. Also learn how changes to the data values affect the correlation coefficient, make contextual deductions based on the correlation coefficient, and identify a possible confounding variable / lurking variable to va
Subjects:
Grades:
9th - 12th
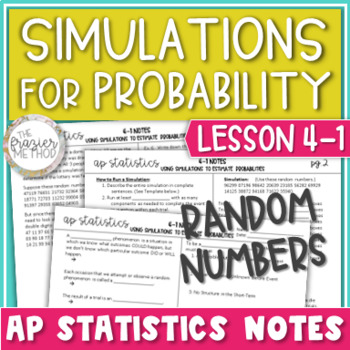
AP Statistics Notes - Using Simulations to Estimate Probabilities
Great AP Statistics notes on USING SIMULATIONS TO ESTIMATE PROBABILITIES! Define and identify trials, random events, outcomes, and components in simulations. Step-by-step directions for how to run a simulation with a TEMPLATE FOR AP STATS FRQs. Also included in this lesson is how to generate random numbers using a TI-84 PLUS CE CALCULATOR function. Aligns with AP College Board's objectives and standards for AP Statistics Unit 4: Probabilities, Random Variables, & Probability Models. WHAT’S I
Subjects:
Grades:
10th - 12th
Also included in: AP Statistics Notes Unit 4 Bundle - Probability Rules & Random Variables
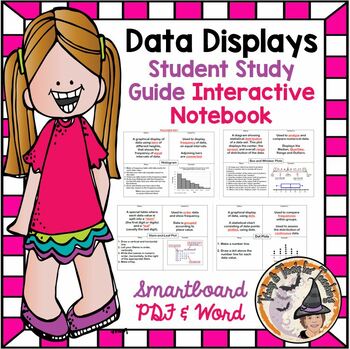
Data Displays Interactive Notes Stem Leaf Box Whiskers Histogram Dot Plots
Teachers ~ You'll LOVE these Interactive Notes that covers the following 4 data displays; Stem and Leaf Plot, Box and Whisker Plot, Histogram, and Dot Plot. The zipfile contains the Teacher's KEY version along with the Student's Fill in the Blank outline for Note Taking. You get BOTH the Students' Notes and the Teacher's KEY in both Word and Pdf formats for easy printing, along with Smartboard slides of everything as well. You'll LOVE using this year after year! Be sure to L@@K at my other 1,285
Subjects:
Grades:
5th - 7th, Staff
7th Grade Unit 8 Open Up Resources I Cans
This product is intended to help students self reflect on their learning revolving around the "I can's" from the Open Up Resources lessons. The students will have all the "I can's" for each lesson already on this printable document, along with the unit and lesson it's in, and four categories to help them assess their learning of the day. The four categories are "I can teach this to others," "do this by myself," "do this with help," and "cannot do this yet."This unit aligns with the Open Up Resou
Subjects:
Grades:
7th
Also included in: 7th Grade Open Up Resources I Can Statements (Units 1-8)
Showing 1-24 of 166 results


