49 results
Statistics unit plans under $5
AP Statistics Summer Assignment - No Prep
This is a no prep, comprehensive pre-assignment for students entering AP Statistics. Included are basic statistical vocabulary words, graphical displays, algebra review, and common formulas and calculator commands for TI-84. Students can also keep this packet throughout the year as a reference tool.
Subjects:
Grades:
10th - 12th, Higher Education
Types:
Michael Jordan vs. LeBron James STEM Unit
Have students who can't stop talking basketball? Capture their love for sports with this STEM unit about two of the greatest basketball players of all time! In this unit, students will use Language Arts, Mathematics, and Technology skills to determine which player is the best. A detailed unit guide is included along with these 7 activities:
Activity #1 = Students will read 2 passages on Michael Jordan and LeBron James followed by reading comprehension questions.
Activity #2 = Students will
Subjects:
Grades:
5th - 8th
Types:
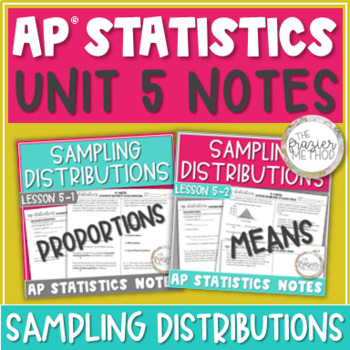
AP Statistics Notes - UNIT 5 BUNDLE - Sampling Distributions Proportions & Means
These AP Statistics notes will help you teach or review SAMPLING DISTRIBUTIONS FOR SAMPLE PROPORTIONS & SAMPLE MEANS! You can also use these notes pages to help your students review for the AP Statistics Exam! Aligns with AP College Board's objectives and standards for AP Statistics Unit 5: Sampling Distributions. WHAT’S INCLUDED IN THIS PRODUCT?5-1 Sampling Distributions of Sample Proportions2 Pages, Blank Pages & Answer KeyIntroduces sampling distributions and sampling distributions of
Subjects:
Grades:
10th - 12th
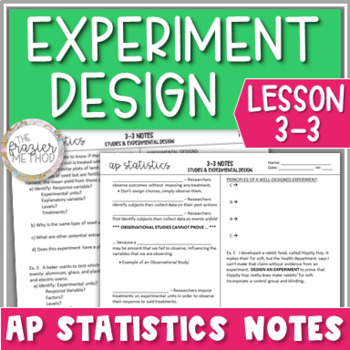
AP Statistics Notes - Experiment Design & Observational Studies
These AP Statistics notes will help you teach or use as an AP Stats review of OBSERVATIONAL STUDIES & EXPERIMENT DESIGN! Students will define and identify explanatory variable, response variable, factor, levels, treatments, control group, and placebo in experiments. With the four Principles of Experimental Design (comparison, randomization, replication, & control), students will learn to design experiments in PARAGRAPHS AND DIAGRAMS FOR FRQs using a completely randomized design, randomiz
Subjects:
Grades:
10th - 12th, Higher Education
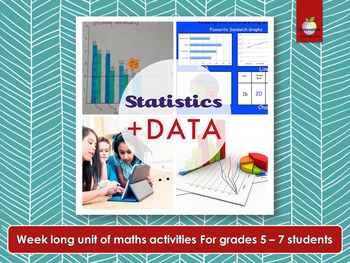
Statistics & Data Math Unit | Project Based Learning | Mean, Median, Mode, Range
Make math relevant and engaging for your students with the elementary/primary STATISTICS and DATA PROJECT. This NO PREP, this hands-on PROJECT-BASED LEARNING, will keep your class busy learning about MEAN, MEDIAN, MODE and RANGE for a whole week.COVERINGHow to ask and survey an “essential question.”Data collection methodsDrawing mathematical conclusions from dataPresenting data in graphs and tablesPresenting data and conclusions to peersThis insightful project makes a great, lively introduction
Subjects:
Grades:
5th - 7th
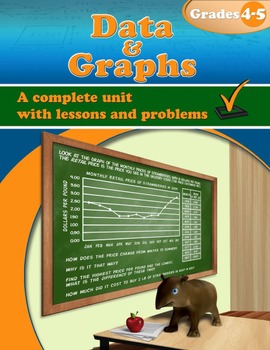
Data and Graphs — Grades 4-5 (Distance Learning)
Data and Graphs — Grades 4-5 is a unit that covers common statistical graphs and some related topics. It is a worktext, containing both the “text” (instruction) and the “work” (exercises and problems).The unit starts with bar graphs, histograms, and various kinds of line graphs. The goals for the study of bar graphs and line graphs are listed here. The student should learn to:1. Read bar graphs, including double bar graphs, and answer questions about already plotted data.2. Draw bar graphs and
Subjects:
Grades:
4th - 5th
Types:
Also included in: Grade 4 Math Units Bundle (Distance Learning)
SMARTIE MATH
Smartie Math. Graphing. Data Analysis.Mathematics has never been so delicious. Students love Smartie Math. The project uses the Nestle candy coated chocolates called 'Smarties' which are marketed in small boxes with a range of 9 to 15 smarties per box. The project seeks to answer the inquiry question, "How does an understanding of statistics help us interpret data?" This project can be done with one class or several. At the school I teach in, a group of ten teachers teach it simultaneously so
Subjects:
Grades:
4th - 8th
Types:
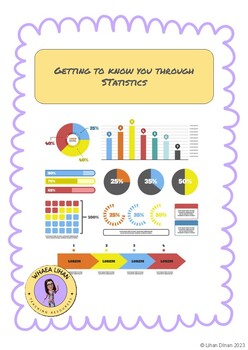
Getting to know you through statistics
Getting to know you through statistics, getting to know your students at the beginning of the teaching year can often resort to the tried and true activities. Why not try something new and find out more about your students likes/dislikes, interests, hobbies through learning. This resources supports you and your students to work through statistics, and working through the PPDAC cycle. It gives you options for making graphs as well as using digital platforms to create your graphs and show your dat
Subjects:
Grades:
Not Grade Specific
Types:
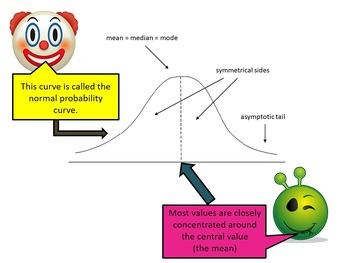
Distributions using Normal Curve - Z score table Statistics Grade 11/12
This Resource is a Statistics Powerpoint on Distributions.The normal bell curved will be investigated along with the Standard Deviation. Z Score tables will be looked at and how to use Z score tables for any type of distribution.Examples, questions and answers have also been provided.Kind RegardsENTER-ONE
Subjects:
Grades:
10th - 12th
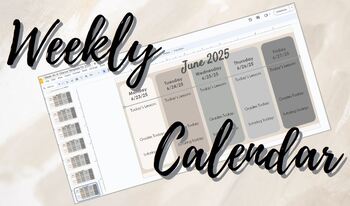
Weekly Calendar for 24-25 School Year (August-June)
Does your school require you to have a week-at-a-glance posted for students and parents? Mine does, so I try to make it fit my personality and have some fun with it. This template has all weeks from August 5, 2024-June 27, 2025 - once you buy, you can delete weeks you do not need. Table rows are formatted to keep your writing lined up with the sections in the background. Rows are "Today's Lesson," "Grades Today," and "Tutoring." Feel free to change them to match your needs.:) Happy Teaching
Subjects:
Grades:
Not Grade Specific
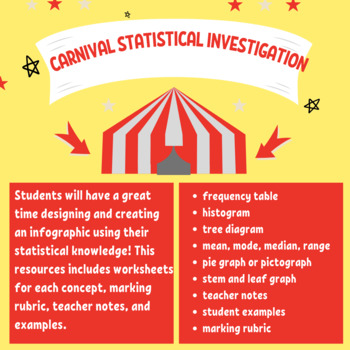
Carnival Statistical Investigation - (Full Statistics Unit)
CARNIVAL STATISTICAL INVESTIGATION!You have been asked to run a stall at the Famous City Carnival!It is up to you what you sell, however, you want to make the most profit possible.It is important that you gain an understanding of what people like so that you make sales. You will need to complete a statistical investigation to create the stall as well as show your understanding and application of statistics.Students will learn and then apply statistical knowledge in each lesson of this unit.Pages
Subjects:
Grades:
5th - 8th
Types:
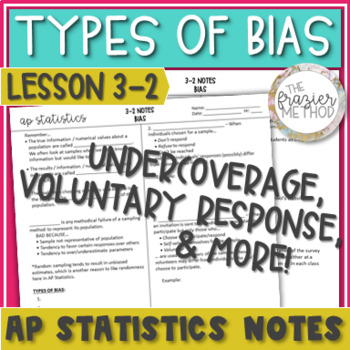
AP Statistics Notes - Types of Bias / Sources of Bias
These AP Statistics notes to help you teach or as an AP Stats review of the TYPES OF BIAS – undercoverage bias, nonresponse bias, voluntary response bias, response bias, question-wording bias, and self-reporting bias! Students will identify the different ways each type of bias may present itself, see examples of each type, and examine how non-random sampling methods introduce potential bias. Also utilize clear instructions for how to answer AP free-response questions involving bias. Aligns with
Subjects:
Grades:
10th - 12th, Higher Education
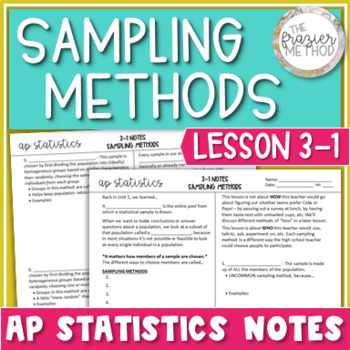
AP Statistics Notes - Sampling Methods : Stratified, Cluster, Systematic, Random
Use these AP Statistics notes to teach or as an AP Statistics review of all 7 SAMPLING METHODS : simple random sample (SRS), stratified sample, cluster sample, systematic sample, convenience sample, multistage sample, & census. Students will learn to distinguish between the 7 sample methods and practice applying them in different contexts. Other vocabulary terms defined in this lesson include population, sample, representative sample, sample frame, sample variability, strata/stratum, & c
Subjects:
Grades:
10th - 12th, Higher Education
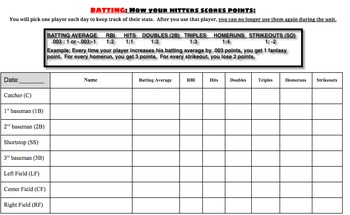
Statistics / Ratios - Fantasy Baseball Project
Using ratios, proportions and statistics, students will be able to analyze baseball statistics to field a fantasy team and maintain scores (which they receive from a ratio chart). They also will be analyzing statistical questions, creating dot plots, box plots and histograms to support their team's data.
The summative task is then to be the GM and explain their thinking.
Subjects:
Grades:
6th - 7th
Types:
Urban Canopy and Tree Equity Investigation Unit
Understanding tree equity, urban canopy cover, and urban heat islands can empower students to become environmentally conscious citizens who actively contribute to creating healthier, greener, and more equitable communities.Included in this product:6-lesson Lesson PlanDepending on your students' age/level, this might take upwards of 6 class periodsLinks to and recommendations for relevant, up-to-date resources from reputable sources to provide students with the best, most accurate information abo
Subjects:
Grades:
4th - 12th
NGSS:
MS-ESS3-2
, 4-LS1-1
, HS-ESS3-3
, 5-ESS3-1
, MS-ESS3-5
...
Also included in: Midwestern Urban Tree Canopy Unit Bundle
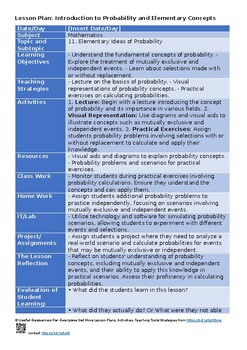
11. Elementary ideas of probability -O Level Statistics 4040 Lesson Plans Unit P
Dive into Probability with Our Comprehensive Lesson Plans! Title: Elementary Ideas of Probability - O Level Statistics 4040 Lesson Plans Unit Plans Thematic Lesson Plans Uncover the world of probability with our meticulously crafted lesson plans. "Elementary Ideas of Probability - O Level Statistics 4040 Lesson Plans Unit Plans Thematic Lesson Plans" offers an engaging exploration of this mathematical concept, equipping students with a strong foundation. Key Features:✨ Syllabus Aligned: Our le
Subjects:
Grades:
5th - 12th, Adult Education, Staff
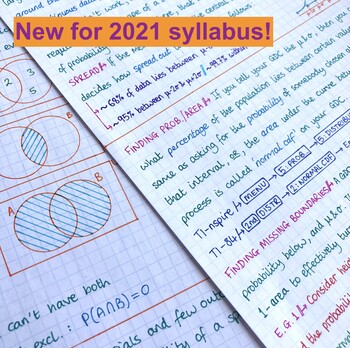
IB Math Analysis & Approaches SL Notes - Unit 4 Stats/Probability
These are handwritten notes for the fourth topic of the new Analysis & Approaches SL (AASL / A&A SL) course, for first exams in 2021. The HL course will contain this content, with some additional statistics subtopics. There will also be significant overlap with the A&I Topic 4. I wrote and sold notes for the old IB courses, which have been fairly successful, so I am in the process of writing notes for the new courses, from scratch.If you want a preview, try the first topic of course
Subjects:
Grades:
10th - 12th
Types:
Also included in: IB Math Analysis & Approaches SL - Complete Notes

Charts & Graphs - Complete Unit of Work
In this unit, students will look at how they can use charts and graphs to represent data in maths. They start by looking at using co-ordinates on graphs, including using graph scales in multiples. Then, students will look at the following graphs – pictograms, bar charts (including composite and comparative bar charts), vertical line graphs, line graphs, histograms with equal class intervals and stem and leaf diagrams. Finally, students will look at how to choose the appropriate graph to display
Subjects:
Grades:
6th - 9th
Also included in: Complete Bundle - All units of work
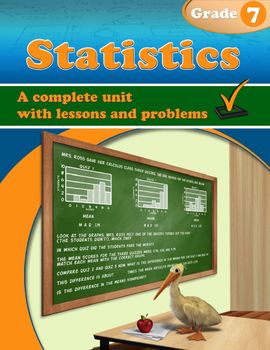
Statistics, Grade 7 (Distance Learning)
The unit Statistics, Grade 7 begins with a review lesson to remind students how to make a boxplot and a histogram and how to calculate the mean absolute deviation — all of which are 6th grade topics.The first focus area of the unit is random sampling. Students learn that sampling methods vary and that random sampling is likely to produce an unbiased sample — a sample that represents the population well. In the lesson Using Random Sampling, students choose several random samples from a population
Subjects:
Grades:
7th
Types:
Also included in: 7th Grade Math Units Bundle (Distance Learning)
6th Grade I Can Posters & Key Vocab CCSS Math: Statistics and Probability**
Now includes blank vocab cards to add your own!
Detailed and kid-friendly "I Can" posters for statistics and probability. The full version also includes key vocabulary terms for the unit in matching borders. These statements can be used to communicate each portion of the common core with students and parents. They can be posted to help students know what they are expected to do.
Each standard has been broken up into small chunks. It has been put into kid-friendly language to help focus o
Subjects:
Grades:
6th
Types:
Also included in: 6th Grade CCSS Math I Can Posters & Word Wall Cards BUNDLE**

Get Science Fair Ready! Project Based Learning Data Literacy for Middles School
Science fair project that helps you teach data management, statistics and probability. Real data and meaningful science! The data literacy and research project covers everything middle school students need to know about collecting and interpreting data for their own animal observation observation project. Great for science fairs! Learn about collecting objective, non-bias data and how to recognize it in the real world. → Everything is included to have students learn about data, collect data and
Subjects:
Grades:
6th - 8th
NGSS:
MS-LS2-1
Also included in: Canadian Grade 6 Math Bundle | For Print and Easel
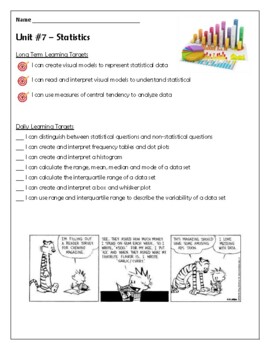
Statistics Unit Packet (6th Grade)
Comprehensive statistics unit aligned to the Next Generation Math standards (6th grade). Includes lessons on statistical questions, frequency tables and dot plots, histograms, mean/median/mode/range, interquartile range, box and whisker plots, and statistical variability. Each lesson includes learning targets, guided notes, guided practice, and classwork problems. Each lesson is also aligned to IXL skills for extra practice. This unit uses real world statistics linked to high-interest topics
Subjects:
Grades:
6th
Types:
0:32
Stats101 Binder
Video clip showing small portion of Student Learning progression created in Live Binder format for all of grade 11-12 Statistics Class.Link to full Binder with purchase.
Subjects:
Grades:
11th - 12th
Types:

Chapter 2 Pre-Printed Notes - Statistics - Organizing Data
These notes accompany Bluman's Elementary Statistics Book. The Unit is entitled Frequency Distributions and Graphs. The graphs covered are histograms, frequency polygons, ogives, pie, pareto charts and time series.
Subjects:
Grades:
10th - 12th
Types:
Showing 1-24 of 49 results


