4 results
Statistics lesson images
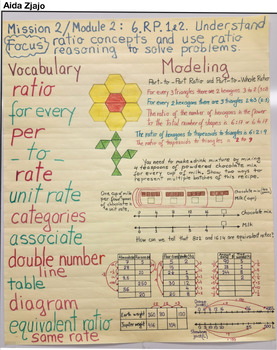
6th Grade Anchor Chart 6.RP.1.2 (Ratios)
6.RP.1-2I made these anchor charts to summarize the Modules' ideas. You will have vocabulary and modeling problem-solving with different strategies from Eureka Module 2 or ZEAR Mission 2. (CCSS)The charts can be used by teachers during intervention time. Other grade levels are good to look into for ideas on what to teach in a small group intervention or just to see which strategies students needed to master in previous grades.
Subjects:
Grades:
6th - 7th
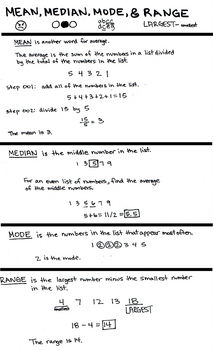
Basic Statistics: Mean, Median, Mode, and Range
An easy guide to learn Mean, Median, Mode, and Range.
Subjects:
Grades:
3rd - 12th
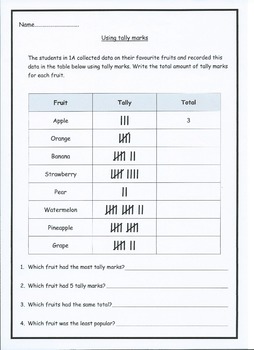
Tally Mark pt.1
This hand-out can be used as an introductory lesson to tally marks. Students will be given the opportunity to learn how to read and interpret tally marks. This activity allows students to interpret data and answer word problems based on a beginners understanding of tally marks.
Subjects:
Grades:
K - 2nd
Types:
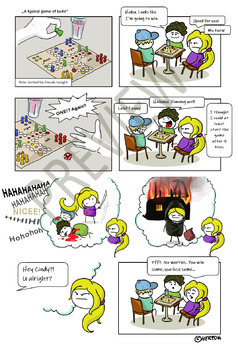
Cumulative binomial distribution - an editable comic (black humor, stochastics)
Hi there,Greetings from Germany!You'll get an editable comic, that you can use to start your math lesson in a different way. I thought it'd be an entertaining way to connect everyday life with the binomial distribution. But maybe you'll find a way to use it in other fields.Fill in the speechbubbles as you like - or leave them empty, so that the students can get creative :)I recommend this comic only for higher grades.
Subjects:
Grades:
9th - 12th
Showing 1-4 of 4 results


