Graphing Lessons and Activities for Charty Party Game
- PDF
- Google Apps™

Also included in
- All of Teacher Toy Shop's Physical Science resources in one place! These are some of the many topics included: waves, forces and motion, matter and energy, solar system, electricity and magnetism, sound, heat transfer, STEM, scale models, graphing, electricity, states of matter, density, propertiesPrice $118.61Original Price $148.61Save $30.00
Description
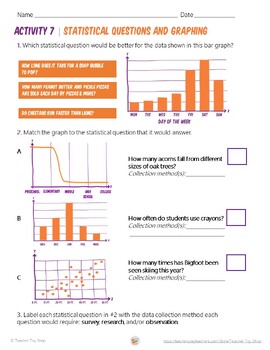
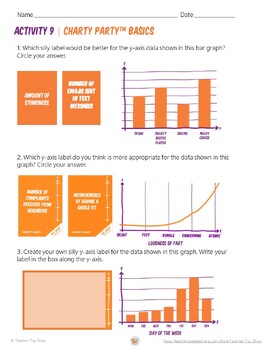
Explore the engaging world of graphing with these Graphing Lessons and Activities for Charty Party Game, featuring nine interactive lessons that seamlessly blend learning with the excitement of a party game. Designed to teach line graphs, bar graphs, scatterplots, and more, these lessons are presented in kid-friendly language, making graphing concepts accessible and enjoyable for students. As they analyze graphs during the Charty Party™ game, students not only practice graphing but also delve into understanding variables, data collection, and crucial mathematical concepts.
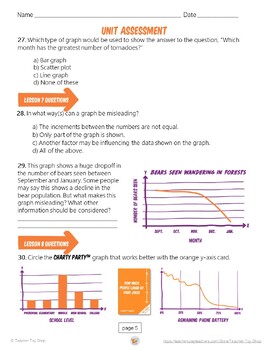
These lessons go beyond the basics, introducing students to trends, outliers, interpolating, extrapolating, independent variables, dependent variables, and the nuances of misleading charts. The resource includes a humorous vocabulary worksheet and a vocabulary reference, providing a comprehensive learning experience. A five-page, 30-question assessment ensures a thorough understanding of the topics covered.
Covering a range of graphing topics such as bar graphs, line graphs, scatterplots, variables, positive and negative trends, outliers, statistical questions, data collection methods, and misleading graphs, this resource is a versatile addition to math and science lessons. Both printable (PDF) and digital versions compatible with Google Slides™ are included, allowing flexibility for use in various educational settings, including Google Classroom™.
Whether used in a traditional classroom setting or for homeschooling, distance learning, or remote learning, this graphing curriculum is a valuable resource authorized by Very Special Games, the company that makes Charty Party™. Elevate your science and math lessons with an interactive and enjoyable approach to graphing that captivates students' attention and reinforces key mathematical concepts.
Please note that to fully enjoy the Charty Party™ game aspect, you will need the Charty Party™ All Ages Edition.
► Topics Covered:
- Bar graphs
- Line graphs
- Scatter plots
- Variables — including dependent and independent variables
- Positive and negative trends in data
- Outliers
- Interpolating and extrapolating
- Statistical questions
- Data collection methods
- Misleading graphs
You Might Also Like...
- Space Worksheets about Distances in Outer Space
- Sound and Light Waves Science Experiments
- Life Size Printable Skeleton
✪ Don't forget to follow Teacher Toy Shop to be the first to know about new products, sales and freebies!


